

Testing. Bentrevett/pytorch-sentiment-analysis: Tutorials on getting started with PyTorch and TorchText for sentiment analysis. Scipy Lecture Notes — Scipy lecture notes. Jupyter. Stats Models. A summary of python code style conventions. “PEP 8: Style Guide for Python Code” and “PEP 257: Docstring Conventions” aren’t exactly long, but they’re also not easily skimmable.
As I’ve just started to learn python, I should make an effort to internalise these best-practice conventions. To help me do that, I’m going to summarise PEP 8 and 257 here, as a quick reference for myself and anyone else who might find it useful. This is not quite an exhaustive summary: I have omitted the really obvious stuff, and in some cases I’ve picked one approach where PEP8 allows a few. These standards can hopefully help in every coders’ ongoing mission to write readable and expressive code.
Python - *args and **kwargs? Python - How to merge two dictionaries in a single expression? First steps — pygal 2.0.0 documentation. Caution First you need to install pygal, see installing.
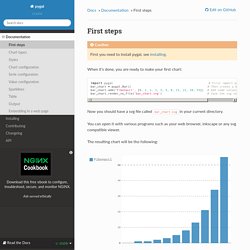
When it’s done, you are ready to make your first chart: import pygal # First import pygalbar_chart = pygal.Bar() # Then create a bar graph objectbar_chart.add('Fibonacci', [0, 1, 1, 2, 3, 5, 8, 13, 21, 34, 55]) # Add some valuesbar_chart.render_to_file('bar_chart.svg') # Save the svg to a file Now you should have a svg file called bar_chart.svg in your current directory. You can open it with various programs such as your web browser, inkscape or any svg compatible viewer. 5 Python Libraries for Creating Interactive Plots. 5 Reasons Why Python Is a Great First Programming Language - Mikke Goes Coding. Choosing your first programming language can be a difficult decision to make.
You’ll be spending a lot of time with it and it’s not always just a walk in the park along the way. There are plenty of suitable languages for a beginner with enough resources online alone for learning pretty much any language out there.
The Hitchhiker’s Guide to Python! Greetings, Earthling!
Welcome to The Hitchhiker’s Guide to Python. This is a living, breathing guide. If you’d like to contribute, fork us on GitHub! This handcrafted guide exists to provide both novice and expert Python developers a best practice handbook to the installation, configuration, and usage of Python on a daily basis. Managing Python Dependencies. Basics of Linear Algebra for Machine Learning. Discover the Mathematical Language of Data in Python Linear algebra is a pillar of machine learning.
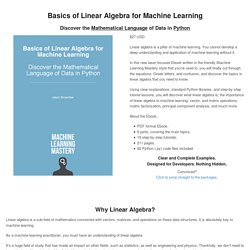
You cannot develop a deep understanding and application of machine learning without it. In this new laser-focused Ebook written in the friendly Machine Learning Mastery style that you’re used to, you will finally cut through the equations, Greek letters, and confusion, and discover the topics in linear algebra that you need to know. Using clear explanations, standard Python libraries, and step-by-step tutorial lessons, you will discover what linear algebra is, the importance of linear algebra to machine learning, vector, and matrix operations, matrix factorization, principal component analysis, and much more. About the Ebook: PDF format Ebook.6 parts, covering the main topics.19 step-by-step tutorials.211 pages.92 Python (.py) code files included. Clear and Complete Examples. Python Tricks Toolkit. Nifty Python tricks. Hi there folks.
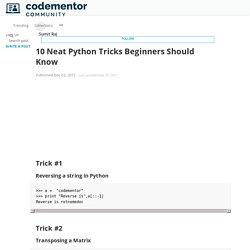
It’s been a long time since I last published a post. I have been busy. However in this post I am going to share some really informative tips and tricks which you might not have known about. So without wasting any time lets get straight to them: 10 Neat Python Tricks Beginners Should Know. Trick #1 Reversing a string in Python >>> a = "codementor" >>> print "Reverse is",a[::-1] Reverse is rotnemedoc Trick #2.
Python - 'import module' vs. 'from module import function' Importing the module doesn't waste anything; the module is always fully imported (into the sys.modules mapping), so wether you use import sys or from sys import argv makes no odds.
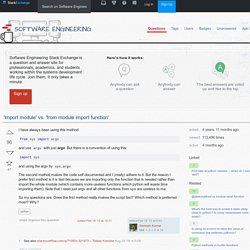
The only difference between the two statements is what name is bound; import sys binds the name sys to the module (so sys -> sys.modules['sys']), while from sys import argv binds a different name, argv, pointing straight at the attribute contained inside of the module (so argv -> sys.modules['sys'].argv). The rest of the sys module is still there, whether you use anything else from the module or not. There is also no performance difference between the two approaches. Yes, sys.argv has to look up two things; it has to look up sys in your global namespace (finds the module), then look up the attribute argv. And yes, by using from sys import argv you can skip the attribute lookup, since you already have a direct reference to the attribute. Liberating data from Microsoft Access “.mdb” files. Many people given the task of managing data reach for the tools available to them on their office computer.

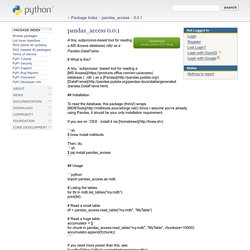
Typically this will include the Microsoft suite of products including the Access database. Not surprisingly, Microsoft Access Database files, “.mdb” files, are difficult to work with if you don’t have Access on your system. (Or even if you do!) In this post we describe how to use freely available tools and and 14 lines of python code to automatically dump the contents of an entire Access database into comma-separated-value files, CSV files, one per table. Recently we began a project that involved data stored in Microsoft Access databases. Pandas_access 0.0.1. A tiny, subprocess-based tool for reading a MS Access database(.rdb) as a Pandas DataFrame. # What is this?
Set 1 (Search and Insertion) - GeeksQuiz. The following is definition of Binary Search Tree(BST) according to Wikipedia Binary Search Tree, is a node-based binary tree data structure which has the following properties: The left subtree of a node contains only nodes with keys less than the node’s key.The right subtree of a node contains only nodes with keys greater than the node’s key.The left and right subtree each must also be a binary search tree. There must be no duplicate nodes. The above properties of Binary Search Tree provide an ordering among keys so that the operations like search, minimum and maximum can be done fast. Breadth First Traversal or BFS for a Graph. Breadth First Traversal (or Search) for a graph is similar to Breadth First Traversal of a tree (See method 2 of this post). The only catch here is, unlike trees, graphs may contain cycles, so we may come to the same node again.
Tree Traversals (Inorder, Preorder and Postorder) Unlike linear data structures (Array, Linked List, Queues, Stacks, etc) which have only one logical way to traverse them, trees can be traversed in different ways. Following are the generally used ways for traversing trees. Example Tree Depth First Traversals: (a) Inorder (Left, Root, Right) : 4 2 5 1 3 (b) Preorder (Root, Left, Right) : 1 2 4 5 3 (c) Postorder (Left, Right, Root) : 4 5 2 3 1. Solution to Brackets by codility – Code Says. Question: Question Name: Brackets Classic application of stacks.
Time series - auto.arima() equivalent for python. Pointers in Python? Autoregression Models for Time Series Forecasting With Python. Autoregression is a time series model that uses observations from previous time steps as input to a regression equation to predict the value at the next time step. It is a very simple idea that can result in accurate forecasts on a range of time series problems. In this tutorial, you will discover how to implement an autoregressive model for time series forecasting with Python. After completing this tutorial, you will know: How to explore your time series data for autocorrelation.How to develop an autocorrelation model and use it to make predictions.How to use a developed autocorrelation model to make rolling predictions. Let’s get started.
9.6. random — Generate pseudo-random numbers — Python 2.7.13 documentation. Source code: Lib/random.py. Pandas. Reference Guide — Bokeh 0.12.4 documentation.webloc. Python data visualization: Comparing 7 tools. The Python scientific stack is fairly mature, and there are libraries for a variety of use cases, including machine learning, and data analysis. Data visualization is an important part of being able to explore data and communicate results, but has lagged a bit behind other tools such as R in the past. Luckily, many new Python data visualization libraries have been created in the past few years to close the gap. matplotlib has emerged as the main data visualization library, but there are also libraries such as vispy, bokeh, seaborn, pygal, folium, and networkx that either build on matplotlib or have functionality that it doesn’t support. Python Tutorial: Hashing (Hash Tables and hashlib)- 2017. Bogotobogo.com site search: Hash Tables When we talk about hash tables, we're actually talking about dictionary.
Python Tutorial: A Tutorial. Tutorial and Online Course. Python-for-data-analysis-part-29. Visual Analytics with Tableau is the third course in the Data Visualization with Tableau Specialization offered by UC Davis on Coursera. The course focuses on teaching Tableau nuts and bolts, including chart options, altering chart color and shapes and making tooltips. The course is front-loaded with about half the lecture content covering general topics in the first week, while each of the three following weeks focus on specific topics including dates, maps and chart calculations.
Similar to the two previous courses in the specialization, assignments are locked unless you pay to register for the full course. A Dramatic Tour through Python’s Data Visualization Landscape (including ggplot and Altair) – Regress to Impress. Why Even Try, Man? I recently came upon Brian Granger and Jake VanderPlas’s Altair, a promising young visualization library. How do I write a Python dictionary to a csv file?
GitHub - tqdm/tqdm: A fast, extensible progress bar for Python. Implementing the Five Most Popular Similarity Measures in Python. In a particular subset of the data science world, “similarity distance measures” has become somewhat of a buzz term. Like all buzz terms, it has invested parties- namely math & data mining practitioners- squabbling over what the precise definition should be. As a result, the term, involved concepts and their usage can go straight over the heads of beginners. So today, I write this post to give simplified and intuitive definitions of similarity measures, as well as diving into the implementation of five of the most popular of these similarity measures.
How to find range overlap in python? Scipy array tip sheet. Arrays are the central datatype introduced in the SciPy package. (The same array objects are accessible within the NumPy package, which is a subset of SciPy. Python: plot a bar using matplotlib using a dictionary. PyFormat: Using % and .format() for great good! Default Parameter Values in Python. Python - numpy: most efficient frequency counts for unique values in an array. A Complete Tutorial to Learn Data Science with Python from Scratch. Introduction. Python - Underscore vs Double underscore with variables and methods.
A guide to Python's function decorators. Python - What does `if __name__ == "__main__":` do? Class - Why do we use __init__ in python classes? Python @property. Python tutorial. FastLanePython. Pygame. How can I get a list of locally installed Python modules? How to run *.py (Python) script.