

Dwilhelm89/Ethermap. GitHub: Bringing GeoJSON To Life Since 2013. Last week, the code repository heroes over at GitHub made an awesome announcement: Any .geojson files living in GitHub repos will now be rendered on a Leaflet-driven, OSM tile-backed map right inside of GitHub, with tooltips showing the data properties to boot!
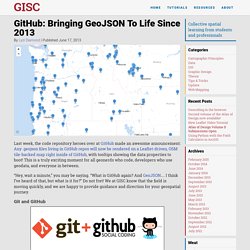
This is a truly exciting moment for all geonerds who code, developers who use geodata, and everyone in between. “Hey, wait a minute,” you may be saying. “What is GitHub again? And GeoJSON… I think I’ve heard of that, but what is it for?” Do not fret! Git and GitHub Before learning about GitHub, we first have to understand git. In order for multiple people to work on a project, the data has to live in a place where multiple people can access it, right? Because git is so great, and GitHub is so popular, people have been using it for all kinds of projects, coding and otherwise. Carto narrative. Projects. Map Gallery. Leaflet Plugins — MapBBCode. During the development of MapBBCode a lot of Leaflet plugins were written.
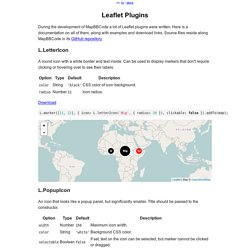
Here is a documentation on all of them, along with examples and download links. Source files reside along MapBBCode in its GitHub repository. L.LetterIcon A round icon with a white border and text inside. Can be used to display markers that don't require clicking or hovering over to see their labels. Download L.PopupIcon An icon that looks like a popup panel, but significantly smaller. Dialoguons - Plateforme participative. OTPA Marseille. OSM Tchoutchou - Raildar with Open Street Map. Mobile-Friendly Mapping for PhoneGap Apps - Modern Web.
By Rob Lauer One of the first and most enduring features of mobile devices was, and continues to be, mapping.
The ability to locate yourself on a map with the tap of a finger, anywhere in the world, has arguably influenced adoption of smartphones and tablets as much as any other feature. Building a mobile mapping application. Leaflet mobile mapping application Our earlier articles on mobile application development demonstrated the process of getting an app up and running on an Android phone using Adobe PhoneGap and GitHub.
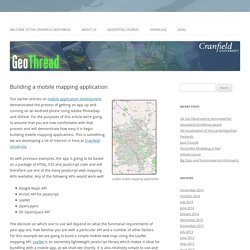
For the purposes of this article we’re going to assume that you are now comfortable with that process and will demonstrate how easy it is begin building mobile mapping applications. This is something we are developing a lot of interest in here at Cranfield University. As with previous examples, the app is going to be based on a package of HTML, CSS and JavaScript code and will therefore use one of the many JavaScript web mapping APIs available.
Loading OSM data. This guide describes how to install, set-up and configure all the necessary software to have a database of OpenStreetMap data which you can use to render maps or develop stylesheets.
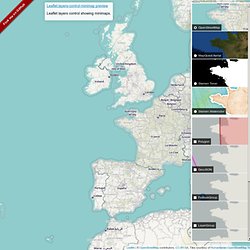
The step-by-step instructions are written for Ubuntu Linux 14.04 LTS (Trusty Tahr), but have notes on adaptations needed for Ubuntu 12.04 LTS (Precise Pangolin). They should transfer without much difficulty to other distributions. Basic Linux command line and PostgreSQL knowledge is required. Plans. Créer une carte. Many points with Leaflet WebGL. Norkart/Leaflet-MiniMap. Leaflet layers control minimap Demo. Fork me on GitHub Leaflet.layers-control-minimap preview Leaflet layers control showing minimaps.
Transport - Thunderforest. Public transport information for every community on Earth - that’s the goal of the Transport map.
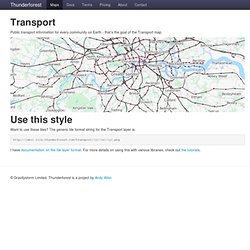
Want to use these tiles? The generic tile format string for the Transport layer is: I have documentation on the tile layer format. For more details on using this with various libraries, check out the tutorials. Etat de l'art des API Web Cartographiques. Read Leaflet Tips and Tricks. Acknowledgements First and foremost I would like to express my thanks to Vladimir Agafonkin.
He is the driving force behind leaflet.js. Read D3 Tips and Tricks. Introduction — QGIS Tutorials and Tips. QGIS is a popular open-source GIS with advanced capabilities.
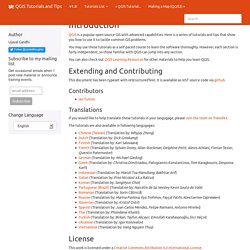
Here is a series of tutorials and tips that show you how to use it to tackle common GIS problems. You may use these tutorials as a self-paced course to learn the software thoroughly. However, each section is fairly independent, so those familiar with QGIS can jump into any section. You can also check out QGIS Learning Resources for other materials to help you learn QGIS. Download.geofabrik.de/europe.html. GEOFLA® Etat de l'art des API Web Cartographiques. RAW. Outillage pour les datavisualisations - WikiEtalab.
La mission Etalab, placée sous l’autorité du Premier ministre au sein du SGMAP, a pour mission d’accompagner l’ouverture des données publiques de l’Etat et des administrations. À ce titre, elle met en oeuvre et anime la plateforme ouverte des données publiques « data.gouv.fr » qui héberge les jeux de données et recense leurs réutilisations. Etat de l'art des API Web Cartographiques. » GeoFLA & D3.js : carte interactive des départements français Lookingfora.name. Créer une carte interactive dans une page Web n’a jamais été aussi facile.
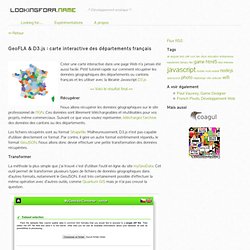
Petit tutoriel rapide sur comment récupérer les données géographiques des départements ou cantons français et les utiliser avec la librairie Javascript D3.js. France découverte O3. uMap. Réduire le poids d'un GeoJSON. Le format GeoJSON est largement utilisé en webmapping. La conversion directe de données géographiques vers le GeoJSON peut produire des fichiers de taille trop importante, qui seront longs à charger et à exploiter. Plusieurs techniques permettent de réduire le poids de ces fichiers.
Ce billet de blog prendra l'exemple des régions dans OpenStreetMap, pouvant être téléchargée dans les exports d'OpenStreetMap France. Study Guides. Mapshaper. Clustering Map Symbols. These maps demonstrate the map symbol clustering features built into Kartograph.js. Mapes web vectorials - D3js. Forum français sur openstreetmap. La conception, c'est toujours la vraie partie difficile/critique d'un logiciel ... Haesus Thoughts — Finding a new way: six great (and free) alternatives to Google Maps. Back in October 2011 Google announced it would start charging the heaviest users of Google Maps and would eventually start inserting ads for other users. Initially Google’s price was set at $4 per 1,000 map views but has since been reduced to 50 cents per 1,000 views. In light of these developments, agencies are increasingly being asked by clients – some of whom are looking at potential bills of tens of thousands of pounds a year – to look for cheaper alternatives.
Luckily for developers, there are many alternatives – with more being developed all the time. What’s really exciting about these new kids on the block is that, rather than being second-rate Google Maps knock-offs, they are producing some really beautiful, characterful maps. While Google Maps being free was great for site owners, it wasn’t necessarily so for app-builders, or the end user, as it suppressed the development of alternatives. 20 superb data visualisation tools for web designers. It's often said that data is the new world currency, and the web is the exchange bureau through which it's traded. As consumers, we're positively swimming in data; it's everywhere from labels on food packaging design to World Health Organisation reports.
As a result, for the designer it's becoming increasingly difficult to present data in a way that stands out from the mass of competing data streams. Get Adobe Creative Cloud One of the best ways to get your message across is to use a visualization to quickly draw attention to the key messages, and by presenting data visually it's also possible to uncover surprising patterns and observations that wouldn't be apparent from looking at stats alone. And nowadays, there's plenty of free graphic design software to help you do just that. As author, data journalist and information designer David McCandless said in his TED talk: "By visualizing information, we turn it into a landscape that you can explore with your eyes, a sort of information map. OpenLayers 3 - Welcome. 20 superb data visualisation tools for web designers. The Land Of Maps. 1910 Map Of Teddy Roosevelt’s Travels From A Dinner: “Welcome home, a dinner to Theodore Roosevelt, June twenty second, nineteen hundred and ten” [2283 × 2809] [OC]CLICK HERE FOR MORE MAPS!
Thelandofmaps.tumblr.com. Introduction — QGIS Tutorials and Tips. OpenShift: Leaflet.js, MongoDB, and Flask. My simple application on OpenShift. Pulling data from MongoDB and presented using Leaflet.js PaaS: Platform as a Service I write a lot of small applications and scripts to improve my programming skills and to hopefully use in my work.
OpenGeo Suite. OpenGeo Suite is a complete geospatial platform for managing data and building maps and applications across web browsers, desktops, and mobile devices. Built on leading open source geospatial software, OpenGeo Suite has a robust and flexible architecture that enables organizations to reliably manage and publish geospatial data. Manage and store data reliably with PostGISPublish maps and data from a variety of formats and sources with GeoServerBuild flexible user interfaces and custom workflows in the browser with OpenLayersAnalyze and publish geospatial data on the desktop with QGISMonitor the performance and value of deployments with MapmeterAccess and edit data using open standards from top to bottom, including OGC standards like WMS, WFS, WCS, and others. → Learn more about the architecture of OpenGeo Suite in our white paper.
Interoperate with Esri, Google, Microsoft, and Oracle → Learn more about how OpenGeo Suite interoperates with other enterprise geospatial solutions. Thematicmapping.org. Keynote. Information into Insight. Faire des calculs géographiques avec postgis — Postgresql - Postgis - de la synergie du géographique et du relationnel dans postgresql-postgis v1.00 documentation. Ce document est proposé comme support à une web conférence organisée par l’ADULLACT intitulée “postgres-postgis : de la synergie du relationnel et du géographique”.
La géometrie est un type de champ de la base de données au même titre qu’une date, qu’un champ texte, un champ numérique ... Cette manière de stocker l’information géographique a un impact sur les applications “métier” des collectivités mais aussi sur leurs applications strictement géographiques : What python web-mapping framework to use? Planet Geospatial » topojson. Code — Frank Purcell v documentation. Shapefile to GeoJSON. Online Shapefile to GeoJSON Converter. OpenStreetMap Public Transport Data. GeoJSON, nouveau lingua franca en géomatique ? Le NoSQL dans le domaine géospatial : MongoDB avec JavaScript ou Python, ArcGIS et Quantum Gis. Python : les bases de données géospatiales - 2) mapping objet-relationnel (ORM, SQLAlchemy, SQLObject, GeoAlchemy, Django-GeoDjango, TurboGears ou MapFish)
GeoJSONLint - Validate your GeoJSON. Données Transport Public OpenStreetMap. Python + Leaflet = Folium, ou comment créer des cartes interactives simplement. GeoAlchemy 2 Documentation — GeoAlchemy2 0.2.4 documentation. GeoDjango Tutorial. What python web-mapping framework to use? Tour. Admin « @comeetie. Geometry Handling in pygp versus arcgisscripting. Pygp Archives - Slashgeo.org. OWSLib 0.8.8 documentation — OWSLib 0.8.8 documentation. Open source - Is there a Python Lib for requesting WMS/WFS and saving as image/PDF? Python + Leaflet = Folium, ou comment créer des cartes interactives simplement. Admin « @comeetie. Specification. Online JSON Viewer. Home · mbostock/topojson Wiki. A blog about mapping, Python, GIS, JavaScript, transit, open data, coding elegance, &c.
Python and GIS Resources. Introduction. Python + Leaflet = Folium, ou comment créer des cartes interactives simplement. Revue de presse du 24 mai 2013. Carte live des tweets géolocalisé en France. Exemple de script Python utilisant QGIS sans l’ouvrir graphiquement. Mattgu74/TwitterHeatMap · GitHub. Les modules Python à finalités géospatiales: quid, quando, ubi ?
Home—Indicatrix. PostGIS — Spatial and Geographic Objects for PostgreSQL. 2. About — Workshop - FOSS4G routing with pgRouting. OpenLayers 3 Examples. OpenTripPlanner. Printing Map Part III: Generate tiles with Mapnik instead of Qgis. QGIS OSM Plugin. Introduction. Discover QGIS. Interface tour. Tour. Leaflet - a JavaScript library for mobile-friendly maps.