

Essential Web Performance Metrics — A Primer, Part 1. Essential Web Performance Metrics — Part 2. Open source performance testing tools. Graph your web performance metrics! Two of my favorite new things in sitespeed.io 3.0 are the ability to drive WebPageTest (done using Marcel Duran’s lovely WebPageTest API wrapper) and send the metrics to Graphite.

I like it a lot because it simplifies my day to day by keeping track of the performance of the sites I work with. What you need To get it up and running you need to install a couple of things. Install sitespeed.io – npm install -g sitespeed.ioInstall your private WebPageTest instance (follow Pat Meenans instructions) or use the public version with a API keyInstall Graphite (the storage for the metrics) – yep, Graphite is a little pain to install, so use a version using Vagrant or let the devops people help youGrafana (a nice looking frontend for Graphite) – download from grafana.org. Open Source Performance Testing Tools. Your application is fast and scalable, right?

How do you know? How often do you run performance or load tests? Davidsonfellipe/awesome-wpo. The performace best practices rules used by Sitespeed.io. Here is a list with all the rules used when analyzing a website and calculating the score.

The weight is the rule's importance, meaning the score of a specific rule, will be weighted with the importance, when calculating the overall score. Avoid slowing down the critical rendering path (criticalpath) Every request fetched inside of HEAD, will postpone the rendering of the page! Do not load javascript synchronously inside of head, load files from the same domain as the main document (to avoid DNS lookups) and inline CSS for a really fast rendering path. The scoring system for this rule, will give you minus score for synchronously loaded javascript inside of head, css files requested inside of head and minus score for every DNS lookup inside of head. 3PO. @font-face and performance. MAJOR CORRECTION: @font-face only blocks rendering in IE when there is a SCRIPT tag above the @font-face declaration.

(more info below) Last week I was reading Ajaxian (my favorite blog) and saw the post about @font-face. 5 years later: print CSS still sucks. This tweet had me revise a 5 year old experiment on how print CSS affects page loading, especially in the light of mobile browsers.
So I tweaked the test ever so slightly to print out timing info in the document.title and after the page is done. The test is essentially how does a slow print stylesheet affect the rendering of the page on the screen. In the experiment I have screen.css delayed with 5 seconds and print.css delayed 10 seconds. Results 5 years ago Browsers blocked rendering waiting for print.css. Frontend SPOF. My evangelism of high performance web sites started off in the context of quality code and development best practices.

It’s easy for a style of coding to permeate throughout a company. Developers switch teams. Code is copied and pasted (especially in the world of web development). If everyone is developing in a high performance way, that’s the style that will characterize how the company codes. CSS and the critical path. Back when I was still actively into speaking at public events (way, way back, something like year and a half ago (which strangely roughly coincides with the time I joined Facebook, hmmm (hmm?

(huh? What's with the parentheses? Sure all of them are closed at this point?)))) I remember showing this slide: Deciphering the Critical Rendering Path. As Steve pointed out in an earlier post, window.onload is not the best metric for measuring website speed.
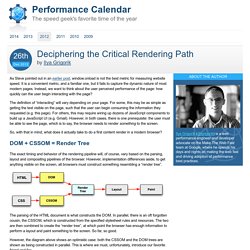
It is a convenient metric, and a familiar one, but it fails to capture the dynamic nature of most modern pages. Instead, we want to think about the user perceived performance of the page: how quickly can the user begin interacting with the page? The definition of “interacting” will vary depending on your page. High Performance Web Sites. These rules are the key to speeding up your web pages.

They've been tested on some of the most popular sites on the Internet and have successfully reduced the response times of those pages by 25-50%. The key insight behind these best practices is the realization that only 10-20% of the total end-user response time is spent getting the HTML document to the browser. A blog about software development. Performance is important, we all know that.

I like performance and I like optimizing websites, but sometimes it’s easy to forget that it’s really all about the users. Don’t do any optimizations unless your users really care! However, quite often they tend to do so… In this post, I will cover a number of tools that I often use to analyze and measure the performance of a website. The tools help us with two things: How fast is the site right now, and where should we start to optimize?