

Using the Quartz scheduler with WebSphere Application Server and the Spring Framework. Quartz is a popular Java open source job scheduler that supports clustering, that means is can make sure that a job is run on exactly one node in a cluster.
Many people run Quartz on WebSphere Application Server but face problems when their Quartz jobs try to access JNDI resources or try to participate in a JTA transaction. 3.3.2.1.- GlassFish 3.1.2.2 (build 5) patches - IP Office Support - WIPO External Wiki. Version 3.1.2.2 (build 5) of GlassFish may require a patch to solve an issue consisting in the flooding of the server log with an error from the Grizzly HTTP server.
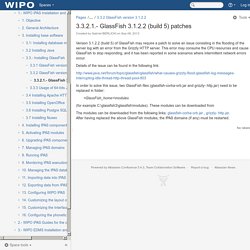
This error may consume the CPU resources and cause GlassFish to stop responding, and it has been reported in some scenarios where intermittent network errors occur. Details of the issue can be found in the following link: [GLASSFISH-17973] Connection leaks when using max-connection-usage-count - Java.net JIRA. I just made some tests with JDBC connection pool tuning and PostgreSQL.
![[GLASSFISH-17973] Connection leaks when using max-connection-usage-count - Java.net JIRA](http://cdn.pearltrees.com/s/pic/th/glassfish-17973-connection-108259797)
As PostgreSQL doesn't have a lot of timeout options (at least version 8.x doesn't), I wanted to prevent certain bad things to happen by configuring our JDBC connection pools to not reuse connection for a long time and so I am now testing the "max-connection-usage-count" parameter. However, enabling this parameter gives me connection leaks. I've already filed a bug for EclipseLink as I think this only happens, when a connection is being destroyed after being used for X times: But still I get the feeling that there is also some ToDo on the GlassFish side as my tests reveal.
For these tests I did the following: Java URLConnection Timeout. Guidelines for HAProxy termination in AWS. This configuration uses an Elastic Load Balancer in TCP mode, with PROXY protocol enabled.
The PROXY protocol adds a string at the beginning of the TCP payload that is passed to the backend. This string contains the IP of the client that connected to the ELB, which allows HAProxy to feed its internal state with this information, and act as if it had a direct TCP connection to the client. For more information on the PROXY protocol, see First, we need to create an ELB, and enable a TCP listener on port 443 that supports the PROXY protocol. The ELB will not decipher the SSL, but instead pass the entire TCP payload down to Haproxy. How To Use HAProxy to Set Up MySQL Load Balancing. Prelude HAProxy is an open source software which can load balance HTTP and TCP servers.
In the previous article on HAProxy we configured load balancing for HTTP and in this one we'll do the same for MySQL. All your MySQL servers have to be configured to perform Master-Master replication as load balancing involves both reading and writing to all the backends. HAProxy version 1.4.26 - Configuration Manual. This section provides a description of each keyword and its usage. acl<aclname><criterion>[flags][operator]<value> ...
Declare or complete an access list. HAProxy - The Reliable, High Performance TCP/HTTP Load Balancer. Load Balancing Using HAProxy. This post is a continuation of Configure Linux using Puppet, in which we configured the (Linux) hosts.
In this post we are going to use Puppet in order to install and configure a WebLogic Server environment. This environment will consist of a WebLogic cluster that spans two (or more) machines, and includes Java Messaging and data source resources (the Java Messaging and data source resources are needed for the application that will be used to test the set-up). In order to install and configure a WebLogic environment, we create five modules wls_repo - defines the used variables, and contains files and templates. wls_install - installs the Java Virtual Machine and WebLogic. wls_basic_config - creates a basic domain (with an Admin Server) and sets-up the Node Manager on the machine where the Admin Server is running. wls_deploy_config - creates the deployment environment, such as clusters, machines, managed servers, messaging resources etcetera.
Puppet File Server. Mechanical Sympathy: Java Garbage Collection Distilled. Serial, Parallel, Concurrent, CMS, G1, Young Gen, New Gen, Old Gen, Perm Gen, Eden, Tenured, Survivor Spaces, Safepoints, and the hundreds of JVM startup flags.
Does this all baffle you when trying to tune the garbage collector while trying to get the required throughput and latency from your Java application? If it does then do not worry, you are not alone. Documentation describing garbage collection feels like man pages for an aircraft. Every knob and dial is detailed and explained but nowhere can you find a guide on how to fly. This article will attempt to explain the tradeoffs when choosing and tuning garbage collection algorithms for a particular workload. Understanding CMS GC Logs (Poonam Bajaj) CMS GC with -XX:+PrintGCDetails and -XX:+PrintGCTimeStamps prints a lot of information.
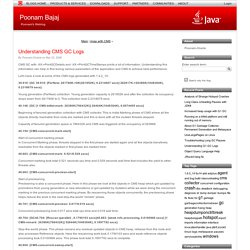
Understanding this information can help in fine tuning various parameters of the application and CMS to achieve best performance. G1 vs CMS vs Parallel GC. This post is following up the experiment we ran exactly a year ago comparing the performance of different GC algorithms in real-life settings.

We took the same experiment, expanded the tests to contain the G1 garbage collector and ran the tests on different platform. This year our tests were run with the following Garbage Collectors: -XX:+UseParallelOldGC-XX:+UseConcMarkSweepGC-XX:+UseG1GC Description of the environment. How to Tune Java Garbage Collection. This is the third article in the series of "Become a Java GC Expert". Stas's blog: The most complete list of -XX options for Java JVM. Java HotSpot VM Options. Please note that this page only applies to JDK 7 and earlier releases. For JDK 8 please see the Windows, Solaris, Linux and Mac OS X reference pages. This document provides information on typical command-line options and environment variables that can affect the performance characteristics of the Java HotSpot Virtual Machine. How to get java thread dump. Java - How to know if Garbage Collector was run during my application runtime? [DISPL-559] Memory leak when using external sorted and ordered list (paginatedList) - jira.codehaus.org.
After sending in production the application was facing some serious memory problems (OutOFMemory). The problem was generated by the TableTag class which was holding some references to the paginatedList. [#GLASSFISH-17468] WebappClassLoader leak after undeployment. Top 10 Causes of Java EE Enterprise Performance Problems. Performance problems are one of the biggest challenges to expect when designing and implementing Java EE related technologies. Some of these common problems can be faced when implementing either lightweight or large IT environments; which typically include several distributed systems from Web portals & ordering applications to enterprise service bus (ESB), data warehouse and legacy Mainframe storage systems.
It is very important for IT architects and Java EE developers to understand their client environments and ensure that the proposed solutions will not only meet their growing business needs but also ensure a long term scalable & reliable production IT environment; and at the lowest cost possible. Performance problems can disrupt your client business which can result in short & long term loss of revenue. Please note that this article is in-depth but I'm confident that this substantial read will be worth your time. Java Benchmark: Glassfish 3.1.2.2 Web Service Memory Leak. I recently installed Netbeans 7.3 with the Glassfish 3.1.2.2 combo, and decided to play with it. So i deployed a simple application that exposes an "echo" web service. Then using JMeter, i stressed the service to see how the server performs: a simple test plan that consists of a group of 5 threads, each thread sending continuously a HTTP request to the web service.
[GLASSFISH-21253] Glassfish consume 100% CPU - Java.net JIRA. My glassfish server consume 100% CPU all day. The system under high load at morning, and at the time I get stack trace, it does not serve any heavy process, I used jstack to trace top 10 child process id of glassfish, and result as below: Thread.State (Java Platform SE 7 ) Linking JVM thread and Linux PID. We can easily identify a problematic java code which leads to high CPU utilization in Linux. Let me explain the steps with the following example, package test; public class ThreadDumpTest { public void test(){ for (int i = 0; i < 10 ; i++) { Thread th=new Thread(new TR(i)); th.setName(“MyThread-“+(1000+i)); th.start(); } } public static void main(String[] args) { ThreadDumpTest t=new ThreadDumpTest(); t.test(); } private class TR implements Runnable{ int ins=0; TR(int i){ ins=i; } public void run(){ while (true) { if(ins!
=5) { try { Thread.sleep(10000); } catch (Exception e) { e.printStackTrace(); } } } } } } In the above example, all the threads are in while loop. Detect your Memory Leaks by counting Surviving Generations: Size matters! — munz & more. The sunshine motivates me to run more these days. VisualVM. JVM_Troubleshooting_Guide.pdf.