
Propuestas 01. Aula Abierta de Matemáticas. ITINERARIO DEL VIAJE: lo que vas a ver.
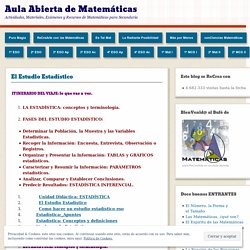
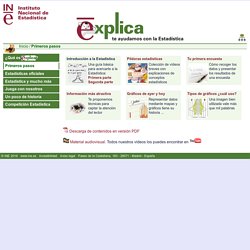
LA ESTADÍSTICA: conceptos y terminología. Explica. Inicio / Primeros pasos Introducción a la Estadística Una guía básica para acercarte a la Estadística: Primera parteSegunda parte Píldoras estadísticas.
Còpia de Lotomat. Proyecto EDIA. Matemáticas. “Detectives Estadísticos” En el REA “Detectives Estadísticos”” el proceso de aprendizaje se centra en el desarrollo del hábito investigador y en el trabajo con la estadística, encuestas y experimentos.

El proyecto propone el reto de convertirnos en investigadores para elaborar una encuesta o experimento, recogiendo, tabulando y organizando datos que se representarán gráficamente. El alumno adquiere conocimientos y los aplica ya que calcula algunos parámetros estadísticos, los analiza y extrae sus conclusiones. Como estrategia motivadora, planteamos un concurso de centro siguiendo las pautas del concurso organizado por la SEIO “Incubadora de Sondeos y Experimentos”.
El objetivo final es que sientan que la estadística no se reduce a un conjunto de fórmulas sino que se utiliza en muchos ámbitos de nuestro entorno. Contenidos Educativos Digitales. Tim Brzezinski sur Twitter : "#Math Ts going to @PCTMpctm (WED 8/7 - THURS 8/8): Invitation to come explore @geogebra's #GraphingCalculator, #Geometry, & #3D apps & how they can naturally foster active, student-centered, discovery learning! (WED 8/7: Sess.
TREINTA ANOS DE INVESTIGACION DIDACTICA SOBRE EL ANALISIS INFERENCIAL DE DATOS. Images des mathématiques. La manifestation du hasard est décrite mathématiquement par des lois de probabilités.
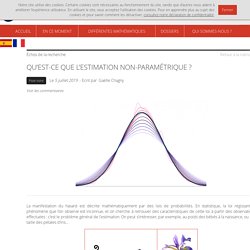
En statistique, la loi régissant le phénomène que l’on observe est inconnue, et on cherche à retrouver des caractéristiques de cette loi à partir des observations effectuées : c’est le problème général de l’estimation. On peut s’intéresser, par exemple, au poids des bébés à la naissance, ou à la taille des pétales d’iris... Paramétrique vs non-paramétrique Dans le cadre de la statistique paramétrique, on suppose que la loi recherchée a une forme particulière (par exemple une loi normale). Il suffit d’en estimer quelques paramètres (moyenne, variance...) pour la décrire complètement. MEI > Teachers > Working with the Large Data Sets in A level Mathematics. Ideas for using the Large Data Sets to teach statistics in A level Mathematics The Integral online resources contain lessons based on the Large Data Sets for the AQA, Edexcel, MEI and OCR specifications.

The lessons include PowerPoint presentations, student worksheets, teacher notes and solutions. Downloading the large data sets Using Desmos for the large data sets The Advanced Mathematics Support Programme (AMSP) has produced workbooks that show how to use Desmos to investigate the large data sets: Help videos: using Excel and GeoGebra for statistics These short videos demonstrate a range of useful techniques for using Excel and GeoGebra for statistics in GCSE and A level Mathematics, including the large data sets. Copying and filtering These videos use the Car fuel and emissions data set.
Cleaning data, dealing with missing data These videos use the World bank data set. Working with charts These videos use the data set OECD.stat (2017) Municipal waste, generation and treatment April 2017. Estadística unidimensional con Geogebra. Statmedia Start. Libro digital interactivo. Random: Probability, Mathematical Statistics, Stochastic Processes. Welcome!
Random is a website devoted to probability, mathematical statistics, and stochastic processes, and is intended for teachers and students of these subjects. The site consists of an integrated set of components that includes expository text, interactive web apps, data sets, biographical sketches, and an object library. Please read the Introduction for more information about the content, structure, mathematical prerequisites, technologies, and organization of the project. Technologies and Browser Requirements This site uses a number of advanced (but open and standard) technologies, including HTML5, CSS, and JavaScript. Display of mathematical notation is handled by the open source MathJax project. Support and Partnerships This project was partially supported by a two grants from the Course and Curriculum Development Program of the National Science Foundation (award numbers DUE-9652870 and DUE-0089377).
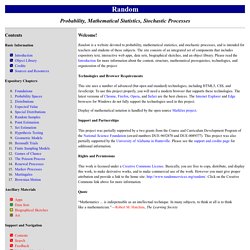
Rights and Permissions This work is licensed under a Creative Commons License. Quote. Biodiversidad. Bases de Datos. Noticia DN16 1 2013 rotada. Conditional probability explained visually. A conditional probability is the probability of an event, given some other event has already occurred.
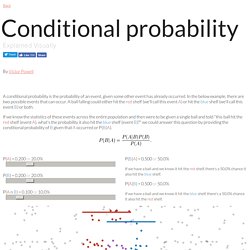
In the below example, there are two possible events that can occur. A ball falling could either hit the red shelf (we'll call this event A) or hit the blue shelf (we'll call this event B) or both. If we know the statistics of these events across the entire population and then were to be given a single ball and told "this ball hit the red shelf (event A), what's the probability it also hit the blue shelf (event B)? " we could answer this question by providing the conditional probability of B given that A occurred or P(B|A).
P(B|A) = 0.500 or 50.0% If we have a ball and we know it hit the red shelf, there's a 50.0% chance it also hit the blue shelf. P(A|B) = 0.500 or 50.0% If we have a ball and we know it hit the blue shelf, there's a 50.0% chance it also hit the red shelf. actual expected.