

Grafana vs. Kibana: The Key Differences to Know - Logz.io. Radar (or Spider :) ) Chart for Kibana 4.3+ and Kibi 0.3+ – Siren Solutions. Evaluating a superhero performance can be tricky … but Kibana/Kibi can help!
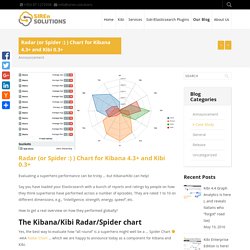
Say you have loaded your Elasticsearch with a bunch of reports and ratings by people on how they think superheros have performed across a number of episodes. They are rated 1 to 10 on different dimensions, e.g., “intelligence, strength, energy, speed”, etc. How to get a real overview on how they performed globally? NGINX Log Analysis with Elasticsearch, Logstash, and Kibana. ElasticHQ - ElasticSearch monitoring and management application. Devoxx 2016 - Journée ElasticsearchSur la route d'Oxiane. Devoxx France 2015 - -Xmx128gb -Xms128gb. I gave recently a talk at Devoxx France 2015 with Colin Surprenant and I’d like to share here some of the examples we used for the talk.

The talk was about “what my data look like?”. We said that our manager was asking us to answer some questions: who are our customers? How do they use our services? What do they think about us on Twitter? Hadoop - Using elasticsearch as central data repository. Jepsen: Elasticsearch. This post covers Elasticsearch 1.1.0.

In the months since its publication, Elasticsearch has added a comprehensive overview of correctness issues and their progress towards fixing some of these bugs. Previously, on Jepsen, we saw RabbitMQ throw away a staggering volume of data. In this post, we’ll explore Elasticsearch’s behavior under various types of network failure. Elasticsearch is a distributed search engine, built around Apache Lucene–a well-respected Java indexing library.
Lucene handles the on-disk storage, indexing, and searching of documents, while ElasticSearch handles document updates, the API, and distribution. As with many distributed systems, Elasticsearch scales in two axes: sharding and replication. Les problématiques Elastisearch. « Près de 2 ans passés chez un client en tant que référent technique d’un middle de recherche basé sur le moteur de recherche Elasticsearch, il me paraît aujourd’hui opportun de vous faire part des différentes problématiques rencontrées au cours des développements et de son exploitation. » « En 2 versions majeures et une montée de version d’Elasticsearch, les problématiques abordées ont été nombreuses : occupation mémoire, ré-indexation sans interruption de service, Split Brain, IDF et partitionnement.
Prêts pour ce retour d’expérience ? » Réindexation sans interruption de service. Elasticsearch: Indexing SQL databases. The easy way. - Search NuggetsSearch Nuggets. Elasticsearch is a great search engine, flexible, fast and fun.

So how can I get started with it? This post will go through how to get contents from a SQL database into Elasticsearch. Rivers are deprecated since Elasticsearch version 1.5. Read this official statement However, river-jdbc lives on as elasticsearch JDBC importer. Some day this post will be updated with instructions for using JDBC importer mode. Elasticsearch has a set of pluggable services called rivers. Elastic vous révèle ce que vos données ont à dire (auparavant Elasticsearch) A Picture Is Worth A Thousand Tokens. Increasingly, we’ve noticed that our agency customers are publishing their highest quality images on social media and within database-driven multimedia galleries on their websites.

These sources are curated, contain metadata, and have both thumbnails and full-size images. That’s a big improvement in quality over the images embedded within HTML pages on agencies’ websites. After some investigating, we decided we could leverage their Flickr and Instagram photos to build an image search engine that better met their needs. We gave it a plucky name and put it in production. See the sample results page below that shows image results displayed on DOI.gov for a search on moon. We also open-sourced the entire codebase behind this project. Snowball Analyzer. From Elephant To ELK. As I mentioned in a recent blog post about image search, we’re avid users of Elasticsearch for search.
We also recently ported another vital part of our system to Elasticsearch: analytics. This post is a technical deep dive into how our analytics system works, and specifically how and why we used Elasticsearch to build it. Background DigitalGov Search is essentially one giant software-as-a-service (SaaS), with 1,500 government websites as its customers. Each site, in turn, is a resource for the public to use.
What We Store Searches: We collect data on what people search on, when they searched, what site they searched from, what we showed them for results (e.g., news, images, recommended content), and various other bits of information to give us context on the search. Clicks: Ideally, a searcher will find a relevant result and click on it. Errors: The vast majority of the time, the whole system hums along nicely. Using Shield with SSO and ldap authorization - Shield - Discuss Elasticsearch, Logstash and Kibana. Visualizing data with Elasticsearch, Logstash and Kibana.
When designing visualizations, we sometimes have to deal with bigger datasets than standard tools can handle.
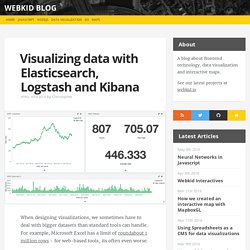
For example, Microsoft Excel has a limit of roundabout 1 million rows - for web-based tools, its often even worse. If you have files that exceed this limit, you can consider the usage of a database which can easily handle big datasheets. But also for smaller datasets, the following techniques enable you to create interactive visualizations within a small amount of time. In this example, I am using Logstash, Elasticsearch and Kibana to create an interactive dashboard from raw data. You actually do not need to have deep knowledge in programming. Quelle solution NoSQL choisir ? Il existe un grand nombre de systèmes de gestion de base de données (216 recensées par db-engines).

De plus en plus de solutions NoSQL voient le jour et elles essayent de répondre à des besoins que les bases de données relationnelles ne peuvent pas résoudre. L’une des réponses apportée par exemple par les systèmes orientés document, est le fait de dénormaliser la donnée en encapsulant des documents les uns dans les autres. L’avantage immédiat est de récupérer toute l’information du document en une seule fois pour être plus rapide en lecture. ES-GLPI – Kibana Pour GLPI En 15 Minutes! Bonsoir à tous!
J’ai récemment eu a migrer ma plateforme GLPI sur un nouvel environnement, et par extension le serveur que j’utilisais pour Kibana, ES etc… Voir les articles précédents sur l’utilisation de Kibana et Elasticsearch avec GLPI : Une fois la nouvelle plateforme GLPI en prod, je me suis attaqué au re-paramétrage du bouzin. Monitoring Avec ELK - ElasticSearch Logstash Et Kibana. Elasticsearch - Template D'Index. Petite astuce, toujours dans l’écosystème Elasticsearch avec lequel je joue pas mal en ce moment… J’ai pas mal galéré à créer un mapping personnalisé pour importer des données via un river JDBC (GLPI Dashboard), mes champs strings passaient automatiquement en « analyzed » et pour jouer avec dans Kibana, c’est pas la joie… Je me suis rendu compte que quand on utilise logstash, par défaut il detecte automatiquement les champs, et pour ceux qui sont « analysés », il ajoute un « champ.raw » qui contient la donnée brute.
J’ai donc cherché un peu de ce côté là et j’ai vu qu’il était possible de créer des templates de mappings en fonction des index! J’ai donc dupliqué le template par défaut de logstash. Elasticsearch. Getting Started with Elasticsearch 5.0 Video: Watch Now New Finally: it's here! And it's there! It's together: your data. Monitoring Your Servers With Nagios Using NRPE and ELK Stack - In this blog, let’s look at the power of three tools—Elasticsearch, Logstash, and Kibana (together known as ELK) in collecting, analyzing, and visualizing all types of structured and unstructured data. You will see the advantages of these tools, and by the end of the article, you will learn how to integrate Nagios Remote Plugin Executor (NRPE) with ELK in order to monitor various system-level metrics. Clogeny has critical expertise in the ELK stack and set it up for several of our customers. ELK Stack: An Introduction The ELK stack consists of Elasticsearch, Logstash, and Kibana.
These are highly popular open-source tools to gather real-time analytics and actionable insights from the data residing on your storage clusters and log files.