

4 Causes of High Testosterone in Women. Obesity - Wikipedia. Hyperinsulinemia - Wikipedia. Insulin binding to its receptor.
Hyperinsulinemia, or hyperinsulinaemia is a condition in which there are excess levels of insulin circulating in the blood relative to the level of glucose. While it is often mistaken for diabetes or hyperglycaemia, hyperinsulinemia can result from a variety of metabolic diseases and conditions. Polycystic ovary syndrome - Wikipedia. Polycystic ovary syndrome (PCOS) is a set of symptoms due to elevated androgens (male hormones) in women.[3][4] Signs and symptoms of PCOS include irregular or no menstrual periods, heavy periods, excess body and facial hair, acne, pelvic pain, difficulty getting pregnant, and patches of thick, darker, velvety skin.[5] Associated conditions include type 2 diabetes, obesity, obstructive sleep apnea, heart disease, mood disorders, and endometrial cancer.[3] PCOS is due to a combination of genetic and environmental factors.[6] Risk factors include obesity, not enough physical exercise, and a family history of someone with the condition.[7] Diagnosis is based on two of the following three findings: no ovulation, high androgen levels, and ovarian cysts.[3] Cysts may be detectable by ultrasound.
Other conditions that produce similar symptoms include adrenal hyperplasia, hypothyroidism, and hyperprolactinemia.[8] Signs and symptoms[edit] Menstrual cycle - Wikipedia. Figure showing the progression of the menstrual cycle and the different hormones contributing to it.
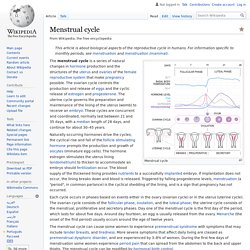
The menstrual cycle is the regular natural change that occurs in the female reproductive system (specifically the uterus and ovaries) that makes pregnancy possible.[1][2] The cycle is required for the production of ovocytes, and for the preparation of the uterus for pregnancy.[1] Up to 80% of women report having some symptoms during the one to two weeks prior to menstruation.[3] Common symptoms include acne, tender breasts, bloating, feeling tired, irritability and mood changes.[4] These symptoms interfere with normal life and therefore qualify as premenstrual syndrome in 20 to 30% of women. In 3 to 8%, they are severe.[3] Onset and frequency[edit] Diagram illustrating how the uterus lining builds up and breaks down during the menstrual cycle. Endometrium - Wikipedia.
The endometrium is the inner epithelial layer, along with its mucous membrane, of the mammalian uterus.
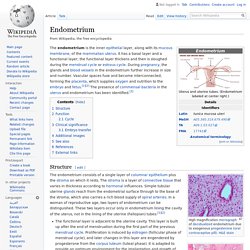
It has a basal layer and a functional layer; the functional layer thickens and then is sloughed during the menstrual cycle or estrous cycle. During pregnancy, the glands and blood vessels in the endometrium further increase in size and number. Vascular spaces fuse and become interconnected, forming the placenta, which supplies oxygen and nutrition to the embryo and fetus.[1][2] The presence of commensal bacteria in the uterus and endometrium has been identified.[3] Structure[edit] Low magnification micrograph of decidualized endometrium. FAQ: What are the differences between one-tailed and two-tailed tests? FAQ: What are the differences between one-tailed and two-tailed tests?
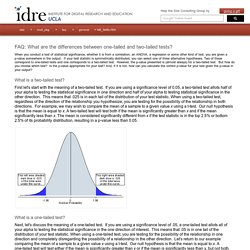
When you conduct a test of statistical significance, whether it is from a correlation, an ANOVA, a regression or some other kind of test, you are given a p-value somewhere in the output. If your test statistic is symmetrically distributed, you can select one of three alternative hypotheses. Two of these correspond to one-tailed tests and one corresponds to a two-tailed test. However, the p-value presented is (almost always) for a two-tailed test. But how do you choose which test? Getting Genetics Done: Using Volcano Plots in R to Visualize Microarray and RNA-seq Results.
I've analyzed some data from GEO (GSE52202) using RNA-seq to study gene expression in motor neurons differentiated from induced pluripotent stem cells (iPSCs) derived from ALS patients carrying the C9ORF72 repeat expansion.

I aligned the data, counted with featureCounts, and analyzed with DESeq2. I uploaded the results to this GitHub Gist. Here's how you can use R to create a simple volcano plot. First, download the results file here and save it as a text file called results.txt. Getting Genetics Done: Using Volcano Plots in R to Visualize Microarray and RNA-seq Results. I've analyzed some data from GEO (GSE52202) using RNA-seq to study gene expression in motor neurons differentiated from induced pluripotent stem cells (iPSCs) derived from ALS patients carrying the C9ORF72 repeat expansion.

I aligned the data, counted with featureCounts, and analyzed with DESeq2. I uploaded the results to this GitHub Gist. Here's how you can use R to create a simple volcano plot. First, download the results file here and save it as a text file called results.txt. Quantile - Wikipedia. Probability density of a normal distribution, with quartiles shown.
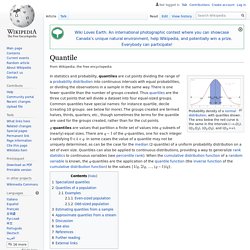
The area below the red curve is the same in the intervals (−∞,Q1), (Q1,Q2), (Q2,Q3), and (Q3,+∞). In statistics and probability, quantiles are cut points dividing the range of a probability distribution into continuous intervals with equal probabilities, or dividing the observations in a sample in the same way. There is one fewer quantile than the number of groups created. Thus quartiles are the three cut points that will divide a dataset into four equal-sized groups. Common quantiles have special names: for instance quartile, decile (creating 10 groups: see below for more). Q-quantiles are values that partition a finite set of values into q subsets of (nearly) equal sizes. Specialized quantiles[edit] Some q-quantiles have special names:[citation needed] Normalization (statistics) - Wikipedia.
Math Q, How to Find the Power? SOLVING LOGARITHMIC EQUATIONS. 1.
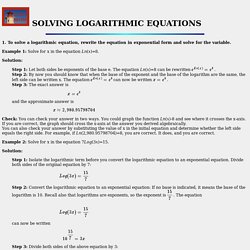
To solve a logarithmic equation, rewrite the equation in exponential form and solve for the variable. Example 1: Solve for x in the equation Ln(x)=8. Solution: Step 1: Let both sides be exponents of the base e. Root Calculator. Logarithm calculator. 3 2 LOGARITHMIC FNS AND THEIR GRAPHS. SOLVING LOGARITHMIC EQUATIONS. LOGARITHM CALCULATOR. Robust Multi-array Average (RMA) RMA is an algorithm used to create an expression matrix from Affymetrix data.
The raw intensity values are background corrected, log2 transformed and then quantile normalized. Next a linear model is fit to the normalized data to obtain an expression measure for each probe set on each array. RMA is very easy to use in J-Express, a description follows further down on this page. All transformations and normalizations change the data, and it is highly recommended to understand how. For more on RMA, see: Irizarry, R. RMAExpress RMAExpress is a stand-alone program by Bolstad et al, which compiles affymetrix chip data into gene expression data. RMA in J-Express Memory usage: RMA uses a lot of memory since it works on all arrays at the same time. How to load affymetrix data using RMA: Open RMA from File | Load Affymetrix data using RMA In the Main settings tab: Locate the CDF File.
2 PreprocessingMicroarrayData 2 Preprocessing and Normalization. 1.4.Preprocess 4up. Chip in differentially expressed genes. Fold change - Wikipedia. However, confusion and ambiguity can arise from this use. For example, although 1 fold is 100%, or 1x, a 1-fold increase, is, as noted above, understood by some to mean an increase of 200%, or a doubling, as in "60 is 2 times greater than 30. " Yet, several dictionaries, including the Oxford English Dictionary[1] and Merriam-Webster Dictionary,[2] as well as Collins's Dictionary of Mathematics, define "-fold" to mean "times," as in "2-fold" = "2 times" = "double. " Likely because of this definition, many scientists use not only fold but also fold change to be synonymous with "times," as in "3-fold larger" = "3 times larger. "[3][4][5] Yet, among some experts in the field use persists of fold change as in "60 is 1-fold greater than 30.
" Converting a fold change to a percentage change[edit] As with any conversion to percent, multiply the fold change by 100. See also[edit] Ratio Notes[edit] Jump up ^ up ^ up ^ Cieńska M, Labus K, Lewańczuk M, Koźlecki T, Liesiene J, Bryjak J. (2016). Using Logarithms in the Real World – BetterExplained. Logarithms are everywhere. Ever use the following phrases? 6 figuresDouble digitsOrder of magnitudeInterest rate You're describing numbers in terms of their powers of 10, a logarithm. And an interest rate is the logarithm of the growth in an investment. Surprised that logarithms are so common? How to calculate "fold changes" in gene expression? LOGARITHM CALCULATOR. Logarithm Important Formulas - Aptitude Questions and Answers. Logarithm:If a is a positive real number, other than 1 and am = x, then we write: m = logax and we say that the value of log x to the base a is m.Examples:(i). 103 1000 log10 1000 = 3. (ii). 34 = 81 log3 81 = 4.
(iv). (.1)2 = .01 log(.1) .01 = 2.The logarithm of a number contains two parts, namely 'characteristic' and 'mantissa'.Characteristic: The internal part of the logarithm of a number is called its characteristic.Case I: When the number is greater than 1.In this case, the characteristic is one less than the number of digits in the left of the decimal point in the given number.Case II: When the number is less than 1.In this case, the characteristic is one more than the number of zeros between the decimal point and the first significant digit of the number and it is negative.Instead of -1, -2 etc. we write 1 (one bar), 2 (two bar), etc.Examples:-Mantissa:The decimal part of the logarithm of a number is known is its mantissa. For mantissa, we look through log table. Help. Fisher's exact test - Wikipedia. Identifying biological themes within lists of genes with EASE.