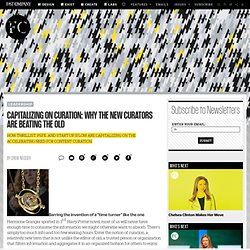

World's Top 7 Smart Cities Of 2015 Are Not The Ones You'd Expect. A Bolzano ecco gli "artigiani digitali" Capitalizing On Curation: Why The New Curators Are Beating The Old. Barring the invention of a "time turner" like the one Hermione Granger sported in 3rd Harry Potter novel, most of us will never have enough time to consume the information we might otherwise want to absorb.

There's simply too much info and too few waking hours. Enter the notion of curation, a relatively new term that is not unlike the editor of old, a trusted person or organization that filters information and aggregates it in an organized fashion for others to enjoy. According to Steve Rosenbaum, author of Curation Nation, "curation is the new way of organizing the web going forward. " And no doubt he's right. Curious about why new curators like Thrillist and PSFK were thriving while the traditional publishing world floundered, I spent some time with their respective founders, Ben Lerer and Piers Fawkes. Thrillist, for the uninitiated, started in 2005 with a newsletter to 600 New Yorkers and is now in 18 markets with 2.5 million subscribers. Long live journalism. 25-09-2010 om 16:40 by Sueli Brodin “Twittering at 5 am? Did you get any sleep at all?” A friend asked me yesterday. The reason for my early morning rise was that I had to catch the 6.15 am train to Amsterdam in order to arrive on time for the day of debates on the future of journalism organised by my colleagues from the Maastricht-based European Journalism Centre at PICNIC 2010.
It was still dark and quiet outside when I left home. After the 2,5 hour journey, I felt like stretching my legs a little and walked to the Westergasfabriek where PICNIC 2010 was taking place. It was the fourth year that the EJC was present at the annual PICNIC festival, a three-day event “that blurs the lines between creativity, science, technology and business to explore new solutions in the spirit of co-creation”. Journalism in the Age of Data: A Video Report on Data Visualization by Geoff McGhee. Things I wish tech journalists would learn. Things I wish tech journalists would learn: Counts are not the same thing as surveys.

Surveys yield projections that have margins of error that should be disclosed and explained. Survey methods should be disclosed and critically examined. If a survey was conducted in order to generate a press release for marketing purposes, it's probably bullshit. Units in distribution pipelines are not the same as units sold to consumers.
Lines outside of stores are a publicity stunt. Companies like Nielsen and Comscore attempt to report on Web traffic, using samples (not counts) and making statistical projections. Small percentage differences often are within the margin of error and are irrelevant. 5 Ways to find, mix and mash your data. One of the most popular trends in online journalism is taking publicly available data and translating it into visualizations or infographics that readers and viewers can quickly and easily understand. A large percentage of the visualizations you see on the web were built from scratch, which can take a considerable amount of time and effort. The following sites allow you to mash your data in record time.
Swivel Swivel features more than 15,000 data sets for users to play with in various categories ranging from Economics to Health to Technology. Facebook: Journalists' friend or foe? By Peter Lauria, contributor A new Facebook effort aims to help journalists use social media.

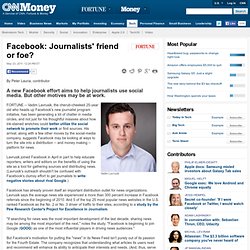
But other motives may be at work. Vadim Lavrusik FORTUNE -- Vadim Lavrusik, the cherub-cheeked 25-year old who heads up Facebook's new journalist program initiative, has been generating a lot of chatter in media circles, and not just for his thoughtful missives about how ink-stained wretches could better utilize the social network to promote their work or find sources. His arrival, along with a few other moves by the social-media company, suggests Facebook may be looking at ways to turn the site into a distribution -- and money making -- platform for news. Lavrusik joined Facebook in April in part to help educate reporters, writers and editors on the benefits of using the site as a tool for gathering sources and distributing news. Facebook has already proven itself an important distribution outlet for news organizations. 10 Awesome Free Tools To Make Infographics. Advertisement Who can resist a colourful, thoughtful venn diagram anyway?

In terms of blogging success, infographics are far more likely to be shared than your average blog post. This means more eyeballs on your important information, more people rallying for your cause, more backlinks and more visits to your blog. In short, a quality infographic done well could be what your blog needs right now. Designing An Infographic Some great tips for designing infographics: Keep it simple! Ideas for infographic formats include: Timelines;Flow charts;Annotated maps;Graphs;Venn diagrams;Size comparisons;Showing familiar objects or similar size or value. Here are some great tutorials on infographic creation: Creating Your Infographic Plan and research.If required, use free software to create simple graphs and visualisations of data.Use vector graphic software to bring these visualisations into the one graphic.
Free Online Tools For Creating Infographics.