

How to merge two large datasets while generate new column with different repeat value in r. R - data.table vs dplyr: can one do something well the other can't or does poorly? Imputing missing data with R; MICE package. Missing data can be a not so trivial problem when analysing a dataset and accounting for it is usually not so straightforward either.
If the amount of missing data is very small relatively to the size of the dataset, then leaving out the few samples with missing features may be the best strategy in order not to bias the analysis, however leaving out available datapoints deprives the data of some amount of information and depending on the situation you face, you may want to look for other fixes before wiping out potentially useful datapoints from your dataset. Broom: a package for tidying statistical models into data frames. The concept of “tidy data”, as introduced by Hadley Wickham, offers a powerful framework for data manipulation, analysis, and visualization.
Popular packages like dplyr, tidyr and ggplot2 take great advantage of this framework, as explored in several recent posts by others. But there’s an important step in a tidy data workflow that so far has been missing: the output of R statistical modeling functions isn’t tidy, meaning it’s difficult to manipulate and recombine in downstream analyses and visualizations. Hadley’s paper makes a convincing statement of this problem (emphasis mine): While model inputs usually require tidy inputs, such attention to detail doesn’t carry over to model outputs. Outputs such as predictions and estimated coefficients aren’t always tidy. In this new paper I introduce the broom package (available on CRAN), which bridges the gap from untidy outputs of predictions and estimations to the tidy data we want to work with.
Fit <- lm(mpg ~ wt + qsec, mtcars)summary(fit) [1412.3565] broom: An R Package for Converting Statistical Analysis Objects Into Tidy Data Frames. An Introduction to reshape2. October 19, 2013 reshape2 is an R package written by Hadley Wickham that makes it easy to transform data between wide and long formats.
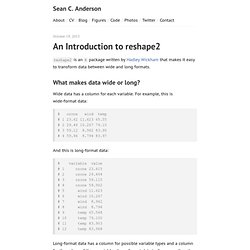
Wide data has a column for each variable. For example, this is wide-format data: # ozone wind temp # 1 23.62 11.623 65.55 # 2 29.44 10.267 79.10 # 3 59.12 8.942 83.90 # 4 59.96 8.794 83.97 And this is long-format data: R - Averaging column values for specific sections of data corresponding to other column values. Reading large data tables in R. Ok, I confess.
Until yesterday I was one of those still trying to read large data tables using read.table. Then, I came across this thread in stackoverflow and I saw the light. Since I noticed that a lot of people still struggle with read.table I decided to write this very brief post. Imagine that you have your large file named “mylargefile.txt”. Then all you have to do is the following. I promise I’ll never go back to read.table again! R-bloggers.com offers daily e-mail updates about R news and tutorials on topics such as: visualization (ggplot2, Boxplots, maps, animation), programming (RStudio, Sweave, LaTeX, SQL, Eclipse, git, hadoop, Web Scraping) statistics (regression, PCA, time series, trading) and more...
Plyr. Comparison of ave, ddply and data.table. This is a copy of a post by me on the R-statistics blog.
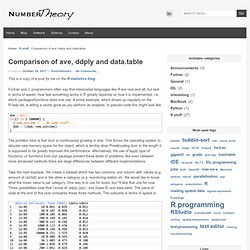
Fortran and C programmers often say that interpreted languages like R are nice and all, but lack in terms of speed. How fast something works in R greatly depends on how it is implemented, i.e. which packages/functions does one use. A prime example, which shows up regularly on the R-help list, is letting a vector grow as you perform an analysis. In pseudo-code this might look like: dum = NULL for(i in 1:100000) { # new_outcome = ...do some stuff... dum = c(dum, new_outcome) } Mages' blog: Say it in R with "by", "apply" and friends. R is a language, as Luis Apiolaza pointed out in his recent post.
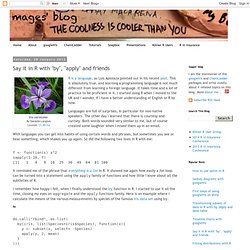
This is absolutely true, and learning a programming language is not much different from learning a foreign language. It takes time and a lot of practice to be proficient in it. I started using R when I moved to the UK and I wonder, if I have a better understanding of English or R by now. Languages are full of surprises, in particular for non-native speakers. The other day I learned that there is courtesy and curtsey. With languages you can get into habits of using certain words and phrases, but sometimes you see or hear something, which shakes you up again. F <- function(x) x^2 sapply(1:10, f) [1] 1 4 9 16 25 36 49 64 81 100 It reminded me of the phrase that everything is a list in R.