

FinCEN Files. Google News Initiative – Google News Initiative. Now Hear This: Augmented Reality Comes to Audio. Ever since the invention of the transistor radio, audio has been a portable, personal medium.

As early as the 1970s, Panasonic was making audio wearable, with an AM radio designed to be worn as a bracelet. The Walkman, the iPod, and now the smartphone have all made audio devices not just something we put in our ears, but something we wear on our bodies. One next step in wearable audio—called “hearables” in some circles—is content customized for a listener’s location. Using a combination of a smartphone’s GPS and motion detectors, as well as audio cues picked up through the microphone, experimental music applications promise to create customized soundtracks for listeners. And, just as iPods were used for playing songs before podcasts took off, news and information is following music’s lead. Bose sells a pair of sunglasses capable of offering the wearer audio augmented reality (AR). However, the technology is not yet in wide release. Smart Speaker Use Is Growing. Will News Grow With It?
On midterm election night last year, NPR carried out its usual live coverage, coordinating stories from its reporters and from member stations across the country.
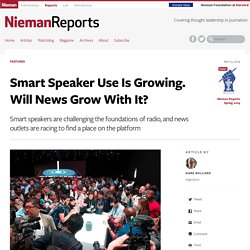
Most of the audience followed along via these stations’ broadcast signals. But those not listening to the radio could get updates, too, by asking Amazon’s voice assistant Alexa for an update on election news from the NPR One app. The response to this request was a short report with the latest news. La ruptura entre el MIT y la mayor editorial científica del mundo es el símbolo más claro de que la ciencia abierta es imparable.
Casi una década ha pasado desde aquel 19 de julio de 2011 en que Aaron Swartz fue arrestado por haber usado la red del MIT para descargarse casi cinco millones de estudios científicos de la base de datos de JSTOR y liberarlos en internet.
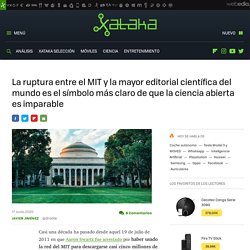
Aquella acusación, más de 35 años de prisión por "fraude electrónico, fraude informático, entrada ilegal e imprudente a un ordenador protegido y daños", y el proceso judicial que desencadenó terminaron abruptamente el 11 de enero de 2013. Fireside Chats — Data Visualization Society. Postdata.club. What Journalists Need to Know. FAQ: Books to read in preparation for doing a data journalism course. This is what you’ll look like after reading all of these books… (“Study of a Man Reading” by Alphonse Legros) This latest in the frequently asked questions series is an answer to an aspiring data journalism student who asks “Would you be able to direct me to any resources or text books that might help [prepare]?”

Here are some recommendations I give to students on my MA in Data Journalism… Books on data journalism as a profession Data journalism isn’t just the application of a practical skill, but a profession with a culture, a history, and non-technical practices. Guía de Periodismo de Investigación by Sala de Prensa. DFRLab. Florence Nightingale is a Design Hero - Nightingale - Medium. Founder of modern nursing.

Feminist champion. Celebrity entrepreneur. Passionate statistician. Political operator. Data visualization. Six Principles for Designing Any Chart - Google Design - Medium. LittleSis - Profiling the powers that be. Data Handbook 1 ToC. Homepage. VIS. Visual Investigative Scenarios platform: Pages. Data Visulization Course Materials. Collection of data visualizations to get inspired and finding the right type. How to Filter in R: A Detailed Introduction to the dplyr Filter Function. Data wrangling.

It’s the process of getting your raw data transformed into a format that’s easier to work with for analysis. It’s not the sexiest or the most exciting work. Learning and Teaching R. As an experienced R user, I have seen numerous social media posts and perhaps even a few stackexchange requests over the years asking the question, “how do I learn R?”.

This is a great question. A related one is, “how do I teach or coach R?” Practical Introduction to Web Scraping in R. Introduction Are you trying to compare price of products across websites?

Are you trying to monitor price changes every hour? Google News Initiative – Google News Initiative. Making it easier to discover data in Search. Google AI Blog: Facilitating the discovery of public datasets. Posted by Natasha Noy, Google Research and Dan Brickley, Open Source Programs Office There are many hundreds of data repositories on the Web, providing access to tens of thousands—or millions—of datasets.
National and regional governments, scientific publishers and consortia, commercial data providers, and others publish data for fields ranging from social science to life science to high-energy physics to climate science and more. Access to this data is critical to facilitating reproducibility of research results, enabling scientists to build on others’ work, and providing data journalists easier access to information and its provenance. Home. Google Developers. Datasets are easier to find when you provide supporting information such as their name, description, creator and distribution formats as structured data.
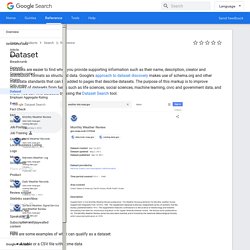
Google's approach to dataset discovery makes use of schema.org and other metadata standards that can be added to pages that describe datasets. The purpose of this markup is to improve discovery of datasets from fields such as life sciences, social sciences, machine learning, civic and government data, and more. Dataset Search. Media Manipulation. Joan Donovan Joan Donovan (PhD, University of California San Diego) was the Media Manipulation Research Lead at Data and Society Research Institute from July 2017-December 2018, where she researched how the internet became a political tool. Currently, she is the Director of the Technology and Social Change Research Project at the Shorenstein Center on Media, Politics and Public Policy at Harvard Kennedy School.
She received her PhD in Sociology and Science Studies at University of California San Diego, where she studied activist communication networks. After UCSD, she went to UCLA for a Post-Doc at the Institute for Society and Genetics, where she studied white nationalists use of science and DNA ancestry tests in the search for racial purity. Alice E. All Generalizations are False - Home of the Media Bias Chart. Crisis de pobreza en el corazón de la isla. Adjuntas - Son las 2:00 de una tarde lluviosa que se mueve lenta como un reptil en el colmado “La Esquina Alegre”, donde su dueño, Edwin Román, única alma en el lugar, juega solitaria sobre el mostrador. La tienda, que ubica en una pronunciada curva del sector Carretera Valdés de este municipio, y al que da la bienvenida un desgastado anuncio de metal de la cerveza puertorriqueña Corona, que no se produce hace más de 30 años, hace tiempo que no hace honor a su nombre.
“Han venido tres personas hoy”, cuenta Román, de 67 años, con un destello de resignación en el semblante. “Entre los primeros dos gastaron seis pesos y el tercero fue fia’o. Stories — The Bureau of Investigative Journalism. Seth Stephens-Davidowitz. Implications of the Data Revolution for Statistics Education. ¿Qué es el periodismo de datos? Quality in Statistical Systems: The Challenge for Puerto Rico.
Quality in Statistical Systems: The Challenge for Puerto Rico Sonia Balet, John E.S. Lawrence. ProPublica Summer Data Institute. Our Materials Here are all of the materials we used to teach the 2016 ProPublica Data Institute: slides, exercises, links, and homework. This is not an online course and doesn’t have all the context or instruction to be a standalone class. However, we’re working on creating one. Sign up here to be notified of any updates to these materials, as well as any announcements about future workshops.
Want to use our slides? Interactive: Ten years of war. The war in Afghanistan - the longest in American history - has changed markedly since US president Barack Obama took office in January 2009. Troop levels remained roughly constant under his predecessor, former president George Bush, with around 30,000 American troops deployed in Afghanistan; the number of coalition military deaths also remained bracketed between 150 and 300. Since Obama took office, both the American "footprint" and the level of violence have incresed sharply. Troop levels by month The "surge" announced by Obama in late 2009 was actually the second of his presidency. About Fusion Tables - Fusion Tables Help.
Topics with Label: Data Journalism - Microsoft Power BI Community. Microsoft Stories. Power BI.