

Online graphing and data analysis. Principal component analysis. Estimation, Validation, and Forecasting. In the Forecasting procedure in Statgraphics, you are given the option to specify a number of data points to hold out for validation and a number of forecasts to generate into the future.
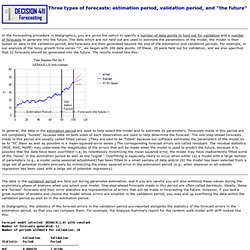
The data which are not held out are used to estimate the parameters of the model, the model is then tested on data in the validation period, and forecasts are then generated beyond the end of the estimation and validation periods. For example, in our analysis of the noisy growth time series "Y", we began with 100 data points. Of these, 20 were held out for validation, and we also specified that 12 forecasts should be generated into the future.
The results looked like this: Www.creasys.it/modules/wfchannel/html/24Ott_Navy_Cost_Centre_of_PLA_content_of_the_presentation_Ms_Gao_Xing.pdf. Www.diva-portal.org/smash/get/diva2:669340/FULLTEXT01.pdf. Www.ukm.my/jsb/jbp/files/paper02. Journal.r-project.org/archive/2013-1/shang.pdf. Robust cost forecasting models with time series analysis in 5 steps. Robust cost forecasting models with time series analysis in 5 steps Posted by Bala Deshpande on Tue, May 29, 2012 @ 08:04 AM Several previous articles have: described the need to develop cost forecasting models, provided a step-by-step method for building cost models, shown how to combine data from many centers (or products) to develop aggregate cost forecasting models.
All of these earlier articles described the various aspects of cost modeling using multiple regression models. The implicit assumption was that the data was "stationary". However, real business data is hardly that. The 2nd Fallacy of Big Data - Information ≠ Insigh... Since we digressed into the topic of influence over the past month, it’s time to return to big data and talk about another big data fallacy.
In my previous Big Data posts, we discussed the data-information inequality (a.k.a. the Big Data Fallacy): information << data. We talked about what is it, how to quantify it, and why it is the way it is. The Key to Insight Discovery: Where to Look in Big... Welcome back, I hope you all had a wonderful new year.
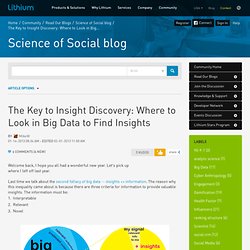
Let's pick up where I left off last year. Last time we talk about the second fallacy of big data -- insights << information. The reason why this inequality came about is because there are three criteria for information to provide valuable insights. The information must be: InterpretableRelevantNovel. Exploratory Data Analysis: Playing with Big Data. In my previous big data post, we discussed the three necessary criteria for information to provide insights that are valuable.
Through this discussion, we learned the key to insights discovery. By definition, an insight must provide something we don’t already know. However, we typically don’t know what we don’t know, so we can’t really look for insights, since we won't know what to look for if we don't know what it is a priori. Big Data Reduction 1: Descriptive Analytics. Now that SxSW interactive is over, it’s time to get back and do some serious business.
Predictive modelling. Predictive modelling is the process by which a model is created or chosen to try to best predict the probability of an outcome.[1] In many cases the model is chosen on the basis of detection theory to try to guess the probability of an outcome given a set amount of input data, for example given an email determining how likely that it is spam.
Models[edit] Nearly any regression model can be used for prediction purposes. Broadly speaking, there are two classes of predictive models: parametric and non-parametric. A third class, semi-parametric models, includes features of both. Parametric models make “specific assumptions with regard to one or more of the population parameters that characterize the underlying distribution(s)”,[2] while non-parametric regressions make fewer assumptions than their parametric counterparts.[3] Group method of data handling[edit] Naive Bayes[edit] k-nearest neighbor algorithm[edit] Majority classifier[edit] Support vector machines[edit] Random forests[edit]
Extrapolation. In mathematics, extrapolation is the process of estimating, beyond the original observation range, the value of a variable on the basis of its relationship with another variable.
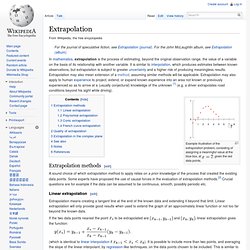
It is similar to interpolation, which produces estimates between known observations, but extrapolation is subject to greater uncertainty and a higher risk of producing meaningless results. Extrapolation may also mean extension of a method, assuming similar methods will be applicable. Extrapolation may also apply to human experience to project, extend, or expand known experience into an area not known or previously experienced so as to arrive at a (usually conjectural) knowledge of the unknown [1] (e.g. a driver extrapolates road conditions beyond his sight while driving). Example illustration of the extrapolation problem, consisting of assigning a meaningful value at the blue box, at , given the red data points. Extrapolation methods[edit] Linear extrapolation[edit] If the two data points nearest the point and ). Big Data Reduction 2: Understanding Predictive Ana... Last time we described the simplest class of analytics (i.e. descriptive analytics) that you can use to reduce your big data into much smaller, but consumable bites of information.
Remember, most raw data, especially big data, are not suitable for human consumption, but the information we derived from the data is. Today we will talk about the second class of analytics for data reduction—predictive analytics. First let me clarify 2 subtle points about predictive analytics that is often confusing. The purpose of predictive analytics is NOT to tell you what will happen in the future. It cannot do that. Prescriptive analytics. Prescriptive analytics is the third and final phase of business analytics (BA) which includes descriptive, predictive and prescriptive analytics.[1][2] Prescriptive analytics automatically synthesizes big data, multiple disciplines of mathematical sciences and computational sciences, and business rules, to make predictions and then suggests decision options to take advantage of the predictions.
The first stage of business analytics is descriptive analytics, which still accounts for the majority of all business analytics today.[3] Descriptive analytics answers the questions what happened and why did it happen. Descriptive analytics looks at past performance and understands that performance by mining historical data to look for the reasons behind past success or failure. Most management reporting - such as sales, marketing, operations, and finance - uses this type of post-mortem analysis. The next phase is predictive analytics. Descriptive statistics. Use in statistical analysis[edit] Descriptive statistics provides simple summaries about the sample and about the observations that have been made. Such summaries may be either quantitative, i.e. summary statistics, or visual, i.e. simple-to-understand graphs.
Big Data Reduction 3: From Descriptive to Prescrip... Welcome back! Let me just make a quick announcement before I dive into big data. As some of you might know, in 2 weeks,LiNC (Lithium Network Conference) will take place at The Westin St. Analytics.