
PepsiCo Price to Book Ratio 2006-2020. EEFT.OQ - Euronet Worldwide, Inc. Profile. United States Rates & Bonds. Sealed Air Corp.: Levered/Unlevered Beta (SEE. Valores Banagricola. Junta Directiva Jaime Alberto Velásquez Botero Ricardo Mauricio Rosillo Rojas Ramón Ávila Qüehl.

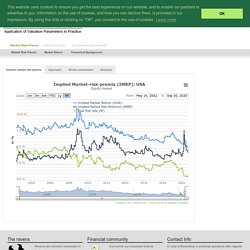
Investopedia: Sharper insight, better investing. US - Market Risk Premia. 1.
Implied cost of capital – The very basics The value of a company is equal to the discounted value of the dividend payments ("Dividend Discount Model"). Dividend Summary 10_24_2020 - Google Sheets. DIVIDEND_OCT_10_2020. Forecasting: Principles and Practice. How does auto.arima() work?
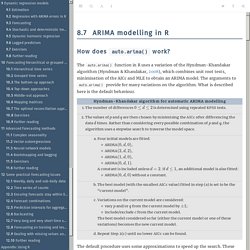
The auto.arima() function in R uses a variation of the Hyndman-Khandakar algorithm (Hyndman & Khandakar, 2008), which combines unit root tests, minimisation of the AICc and MLE to obtain an ARIMA model. The arguments to auto.arima() provide for many variations on the algorithm. What is described here is the default behaviour. The default procedure uses some approximations to speed up the search. These approximations can be avoided with the argument approximation=FALSE. Choosing your own model If you want to choose the model yourself, use the Arima() function in R. Modelling procedure When fitting an ARIMA model to a set of (non-seasonal) time series data, the following procedure provides a useful general approach.
The Hyndman-Khandakar algorithm only takes care of steps 3–5. The process is summarised in Figure 8.11. Figure 8.11: General process for forecasting using an ARIMA model. Example: Seasonally adjusted electrical equipment orders Understanding constants in R. Clustered and Stacked Column and Bar Charts - Peltier Tech Blog. Excel has built-in chart types for clustered columns and bars, and for stacked columns and bars.
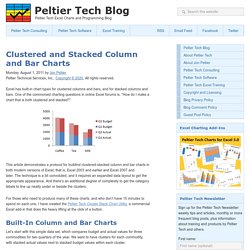
One of the commonest charting questions in online Excel forums is, “How do I make a chart that is both clustered and stacked?” This article demonstrates a protocol for buildind clustered-stacked column and bar charts in both modern versions of Excel, that is, Excel 2003 and earlier and Excel 2007 and later. The technique is a bit convoluted, and it requires an expanded data layout to get the appropriate appearance. And there’s an additional degree of complexity to get the category labels to line up neatly under or beside the clusters. For those who need to produce many of these charts, and who don’t have 15 minutes to spend on each one, I have created the Peltier Tech Cluster Stack Chart Utility, a commercial Excel add-in that does the heavy lifting at the click of a button. Dividend Summary 9:4:2020 - Google Sheets.
EE.UU. - Nuevas peticiones de subsidio por desempleo. Riesgo País EMBI – América Latina – Serie Histórica. Serie histórica del riesgo país para América Latina.

Argentina, Brasil, Uruguay, Paraguay, República Dominica, El Salvador, Chile, Colombia, Ecuador, México, Panamá, Perú, Venezuela. El EMBI (Emerging Markets Bonds Index o Indicador de Bonos de Mercados Emergentes) es el principal indicador de riesgo país y está calculado por JP Morgan Chase.1 Es la diferencia de tasa de interés que pagan los bonos denominados en dólares, emitidos por países subdesarrollados, y los Bonos del Tesoro de Estados Unidos, que se consideran «libres» de riesgo.
Este diferencial (también denominado spread o swap) se expresa en puntos básicos (pb). Una medida de 100 pb significa que el gobierno en cuestión estaría pagando un punto porcentual (1%) por encima del rendimiento de los bonos libres de riesgo, los Treasury Bills. Free Stock Screener. 2721 Valor Ln - Pomona CA. Calculadora foward de Forex - Investing.com. Youtube. Damodaran On-line Home Page. My name is Aswath Damodaran, and I teach corporate finance and valuation at the Stern School of Business at New York University.
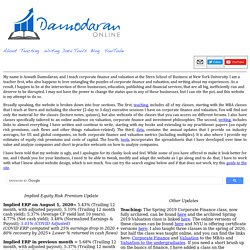
I am a teacher first, who also happens to love untangling the puzzles of corporate finance and valuation, and writing about my experiences. As a result, I happen to be at the intersection of three businesses, education, publishing and financial services, that are all big, inefficiently run and deserve to be disrupted. I may not have the power to change the status quo in any of these businesses, but I can stir the pot, and this website is my attempt to do so. Broadly speaking, the website is broken down into four sections. Betas. Grabador de Pantalla Gratis – Capture la Pantalla de Su PC Gratis. Monedas Código(ISO) - Forex - Tipo de Cambio. The Dividend Investing Resource Center - Information, Tools, And Forms. Dividend Spreadsheet Dividend Calendar With the The Dividend Calendar you see in which month you need to own the stock to get dividends according to the ex-date and when dividends get paid according to the payment date.
Dividend Meter The Dividend Meter is a spreadsheet created in Google Sheets. It automatically imports current stock quotes and annual dividend figures. Dividend Tracking Track Your Dividends makes it easy to track all your Canadian and US dividend income all in one easy to use interface. Portfolio Management Stock.Div lets you manage your portfolio easily and conveniently, where everything you need to make better decisions about your portfolio is right at your fingertips. Portfolio Slicer Portfolio Slicer is a free Excel workbook that lets you track your investments (stocks, ETFs, mutual funds) your way.
Budget Spreadsheet Calculators Dividend Income Calculator was developed to help users better define particular companies ripe for investment. Ebooks para Emprendedores – Google Drive. Libros de Economía Gratis: Trading. Analyzing 50 million records in Excel - Master Data Analysis. Ninite - Install or Update Multiple Apps at Once. W3Schools Online Web Tutorials. USA Learns Homepage. LearnEnglish-online - Improve Your English for Free! In Action - Integration Framework for SAP Business One. Course Summary In a growing business, it’s increasingly important to have integration between different systems and to automate data transfer between the existing systems.
To optimize daily work and to reduce data inconsistency, it’s important to integrate different data sources. So basically, it’s all about integration. Designed for small and midsize businesses, SAP Business One is a complete, innovative, extensible and flexible ERP solution. For managing data transfer, SAP provides the integration framework for SAP Business One as an integration platform. The integration framework for SAP Business One is a collaboration infrastructure for the small and medium-sized enterprise (SME) market. This course will give you the chance to learn about the capabilities of the integration framework and to build your own integration scenarios using different data sources. Course Characteristics Starting from: November 7, 2017, 09:00 UTC. Course Content Target Audience DevelopersTechnical consultants.