
IELTS Writing Task 1 - tips and advice. Graphs: Vocabulary. You need to know some special vocabulary for graphs.
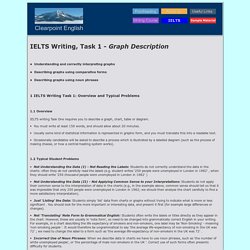
In the IELTS exam, you have to write only 150 words, so show how much vocabulary you know. You don’t need to repeat the same words! Movement (Verbs): Up RoseWent upIncreasedGrewShot upSurgedRocketed Movement (Verbs): Down FellDeclinedDroppedDecreasedSankWent downPlungedPlummeted Prepositions Between 1995 and 2000From 1995 to 2000Sales rose from 200 to 250Sales fell to 150 in MarchSales fell by 50% Adverbs and intensifiers slightlya littlea lotsharplysuddenlysteeplygraduallygentlysteadily No Movement: (Verbs with Adjectives, Verbs) remained steadywere unchangeddid not changeremained constantremained stablestabilized Tops and Bottoms reached a peakpeakedreached their highest levelfell to a lowsank to a troughreached a bottom Passengers at a London Underground Station Click here for a sample text in a new window.
The graph shows the fluctuation in the number of people at a London underground station over the course of a day. Vocabulary Tips. Writing task one: bar graphs. Describing graphs. • Understanding and correctly interpreting graphs • Describing graphs using comparative forms • Describing graphs using noun phrases 1 IELTS Writing Task 1: Overview and Typical Problems 1.1 Overview IELTS writing Task One requires you to describe a graph, chart, table or diagram. • You must write at least 150 words, and should allow about 20 minutes. • Usually some kind of statistical information is represented in graphic form, and you must translate this into a readable text. • Occasionally candidates will be asked to describe a process which is illustrated by a labelled diagram (such as the process of making cheese, or how a central-heating system works). 1.2 Typical Student Problems • Just ‘Listing' the Data: Students simply ‘list' data from charts or graphs without trying to indicate what is more or less significant.
. • Not ‘Translating' Note Form to Grammatical English: Students often write the labels or titles directly as they appear in the chart. 2.1 Task: Graph Interpretation. Describing graphs. In this unit we look at the language used to describe charts and graphs.
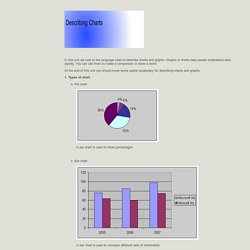
Graphs or charts help people understand data quickly. You can use them to make a comparison or show a trend. At the end of this unit you should know some useful vocabulary for describing charts and graphs. 1. Types of chart. Pie chart A pie chart is used to show percentages Bar chart A bar chart is used to compare different sets of information Line graph A lline graph is most useful for showing trends. 2. A trend is a general tendency or direction. an upward/downward trend 3. IELTS Bar and Line Graph. This is an example of an IELTS bar and line graph together.
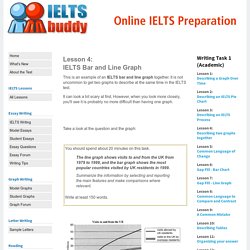
It is not uncommon to get two graphs to describe at the same time in the IELTS test. It can look a bit scary at first. However, when you look more closely, you'll see it is probably no more difficult than having one graph. Take a look at the question and the graph: These are the steps you need to take to describe a bar and line graph together (or any two graphs) that may differ slightly from when you describe one graph. Introduction When you state what the graph shows, mention both of them. The line graph illustrates the number of visitors in millions from the UK who went abroad and those that came to the UK between 1979 and 1999, while the bar chart shows which countries were the most popular for UK residents to visit in 1999.
Remember to write this in your own words and not to copy from the question. Next you need to mention the key points from the graph. Body Paragraphs. The EFL SMARTblog: Describing Graphs and Charts. You are going towatch a video and read about recent changes in British social attitudes on marriage, relationships, religion and welfarepractise numbers, percentages, fractions, the language of graphs and statisticslisten to people giving opinions 1) Discuss What are the British like?

Are we conservative and traditional or liberal and tolerant? Do you think the UK has changed in the last 30 or 50 years? Has your country changed in the last 30 or 50 years? 2) Discuss Look at the opinions in the exercise below. 3) WatchChanges in British social attitudes since 1983 Watch the video. 1) Put the opinions in the exercise above in the order you hear them. 2) What other information does the video tell you about British views on marriage, religion, welfare and relationships? Source 3) Watch again and answer these questions. 4) DiscussWhat language do we use to describe graphs, data and statistics?
5) Read A) How many of these words do you understand? IELTS Writing Task 1: How to Describe a Bar Chart. IELTS Academic Task 1 How to describe a Pie Chart.