

Structure for 6 sessions. Functional Database Model. The functional database model is used to support analytics applications such as Financial Planning and Performance Management.
The functional database model, or the functional model for short, is different from but complementary to, the relational model. The functional model is also distinct from other similarly named concepts, including the DAPLEX functional database model,[1] and functional language databases. The functional model is part of the online analytical processing (OLAP) category since it comprises multidimensional hierarchical consolidation. But it goes beyond OLAP by requiring a spreadsheet-like cell orientation, where cells can be input or calculated as functions of other cells. Also as in spreadsheets, it supports interactive calculations where the values of all dependent cells are automatically up to date whenever the value of a cell is changed. Overview[edit] Analytics Context[edit] Predictive analytics. Statistical techniques analyzing facts to make predictions about unknown events Predictive analytics encompasses a variety of statistical techniques from data mining, predictive modelling, and machine learning, that analyze current and historical facts to make predictions about future or otherwise unknown events.[1][2]
Data mining. Business analytics. Business analytics (BA) refers to the skills, technologies, practices for continuous iterative exploration and investigation of past business performance to gain insight and drive business planning.[1] Business analytics focuses on developing new insights and understanding of business performance based on data and statistical methods.
In contrast, business intelligence traditionally focuses on using a consistent set of metrics to both measure past performance and guide business planning, which is also based on data and statistical methods. Business analytics makes extensive use of statistical analysis, including explanatory and predictive modeling,[2] and fact-based management to drive decision making. It is therefore closely related to management science. Analytics may be used as input for human decisions or may drive fully automated decisions. HOLAP. HOLAP (hybrid online analytical processing) is a combination of ROLAP (Relational OLAP) and MOLAP (Multidimensional OLAP) which are other possible implementations of OLAP.
HOLAP allows storing part of the data in a MOLAP store and another part of the data in a ROLAP store, allowing a tradeoff of the advantages of each. The degree of control that the cube designer has over this partitioning varies from product to product. Vertical partitioning[edit] MOLAP. MOLAP (multidimensional online analytical processing) is an alternative to the ROLAP (Relational OLAP) technology.
While both ROLAP and MOLAP analytic tools are designed to allow analysis of data through the use of a multidimensional data model, MOLAP differs significantly in that (in some software) it requires the pre-computation and storage of information in the cube — the operation known as processing. Most MOLAP solutions store these data in an optimized multidimensional array storage, rather than in a relational database (i.e. in ROLAP).
There are many methodologies and algorithms for efficient data storage, aggregation and implementation specific business logic with a MOLAP Solution. As a result there are many misconceptions to what the term specifically implies. MOLAP vs. ROLAP. ROLAP (relational online analytical processing) is an alternative to the MOLAP (Multidimensional OLAP) technology.
While both ROLAP and MOLAP analytic tools are designed to allow analysis of data through the use of a multidimensional data model, ROLAP differs significantly in that it does not require the pre-computation and storage of information. Instead, ROLAP tools access the data in a relational database and generate SQL queries to calculate information at the appropriate level when an end user requests it.
With ROLAP, it is possible to create additional database tables (summary tables or aggregations) which summarize the data at any desired combination of dimensions. While ROLAP uses a relational database source, generally the database must be carefully designed for ROLAP use. A database which was designed for OLTP will not function well as a ROLAP database. ROLAP vs. OLAP cube. An example of an OLAP cube An OLAP cube is a term that typically refers to multi-dimensional array of data.
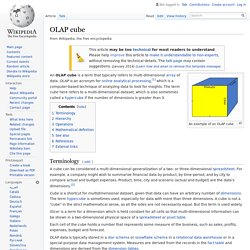
OLAP is an acronym for online analytical processing,[1] which is a computer-based technique of analyzing data to look for insights. The term cube here refers to a multi-dimensional dataset, which is also sometimes called a hypercube if the number of dimensions is greater than 3. Terminology[edit] Hypercube. An n-dimensional hypercube is also called an n-cube or an n-dimensional cube.
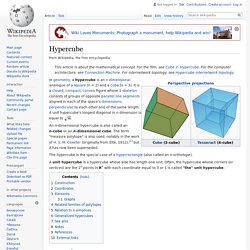
The term "measure polytope" is also used, notably in the work of H. S. M. Coxeter (originally from Elte, 1912),[1] but it has now been superseded. Online analytical processing. Digital Transformation of Business and Society. Let’s explore our emerging future together at Frank Diana’s Blog Reimagine the future through video on Youtube Updated December 14, 2018: The anchor visual in this post continues to evolve.
Considering the increased traffic to the post, the visual has been updated. Updated July 26, 2018: The anchor visual in this post has been updated several times to reflect new and emerging future scenarios, The current version can be found Here. At a recent KPMG Robotic Innovations event, Futurist and friend Gerd Leonhard delivered a keynote titled “The Digital Transformation of Business and Society: Challenges and Opportunities by 2020”. With regard to future thinking, Gerd used my future scenario slide to describe both the exponential and combinatorial nature of future scenarios — not only do we need to think exponentially, but we also need to think in a combinatorial manner.
Gerd has been using the term “Hellven” to represent the two paths technology can take. Source: B. Lean vs 6Sigma. Methodology. What Is Six Sigma? Six Sigma – what does it mean?

“Six Sigma is a quality program that, when all is said and done, improves your customer’s experience, lowers your costs, and builds better leaders. — Jack Welch Six Sigma at many organizations simply means a measure of quality that strives for near perfection. Six Sigma is a disciplined, data-driven approach and methodology for eliminating defects (driving toward six standard deviations between the mean and the nearest specification limit) in any process – from manufacturing to transactional and from product to service.
The statistical representation of Six Sigma describes quantitatively how a process is performing. To achieve Six Sigma, a process must not produce more than 3.4 defects per million opportunities. The fundamental objective of the Six Sigma methodology is the implementation of a measurement-based strategy that focuses on process improvement and variation reduction through the application of Six Sigma improvement projects. What is business analytics (BA)? - Definition from WhatIs.com. Business analytics (BA) is the practice of iterative, methodical exploration of an organization’s data with emphasis on statistical analysis. Business analytics is used by companies committed to data-driven decision making. By submitting your email address, you agree to receive emails regarding relevant topic offers from TechTarget and its partners.
You can withdraw your consent at any time. Contact TechTarget at 275 Grove Street, Newton, MA. You also agree that your personal information may be transferred and processed in the United States, and that you have read and agree to the Terms of Use and the Privacy Policy. Business analytics.