

Gephi Workshop. Network Layout Explanation The next workshop will be held at Stanford in Meyer Library 220 (the Flex classroom) on November 11th at 11AM.

PDF of the Lecture Portion of the Workshop Overview of Network Analysis and Representation Sample Data for the Workshop I’ll occasionally be able to provide two-hour workshops on the basics of using Gephi, the network analysis package with which I’ve made the images and videos below. Getting graph data into Gephi using .gexf, .csv and database connectionsrunning Filters, Analytics and Layouts on the dataoptimization of Gephi for large datasetsoverview of layout algorithms and strategies for their usecreating dynamic (time-enabled) networksgeneral Q&A The last bit is probably the most valuable and hardest to quantify. You will need to bring your own laptop with Gephi already installed. Knowledge Graphs: The New Type of Document for the 21st Century. Neatoguide.pdf. Dunne13Motifsimplification_improving.pdf.
My maps. Network. Gephi is a network visualization and analysis tool.
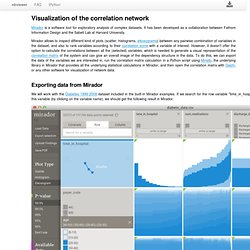
It offers many layouts to represent network data (force atlas, circular, etc.), as well as clustering and other analysis options. Our script save the correlation matrix in CSV format, which can be imported from Gephi as an undirected, weighted graph: For our correlation matrix data, we can generate a force-directed layout where we will see two major groups of variables, first those that correspond to the diagnosis procedures, with admission source ID as the central node, and second the actual laboratory variables, that don't connect directly to time in hospital, but to readmission instead. Many other representation are also possible, for example the circular layout, which in this case doesn't seem to be as informartive as the force-directed layout:
Pierantoni_manuele_tesi.pdf. 2013 NodeXL Social Media Network Analysis. Derosas_-Analisi_delle_reti_visita_guidata.pdf. Visualizzare il proprio grafo sociale su iPad con Facegraph. Da quando sono un utente di iPad, tutti i miei sforzi alla ricerca di app sono dedicati per queste categorie: i social media, le scienze sociali, gli strumenti di visualizzazione, gli strumenti per pianificare i voli aerei (quest’ultima categoria per ovvi motivi).
Che iPad sia un ottimo strumento per visualizzare e manipolare dati non è certamente una novità. Non solo esistono diverse applicazioni, ma l’interfaccia touch basata su gesti e movimenti della mano permette una capacità manipolativa dei dati assolutamente straordinaria, come mostrano progetti anche sofisticati come Kill Math. Tra gli strumenti in grado di visualizzare il grafo sociale, uno dei più interessanti è senza dubbio Facegraph. SNA Lizzner - Intelligence from social media. Social Collider: scanning... Matteorisponde (0/1) Social Network Analysis.
2013 NodeXL Social Media Network Analysis. Visualize communities. Time. Big data? Ecco dieci strumenti per capire e far parlare i dati. La crescente mole di dati prodotti quotidianamente da persone e macchine sta rendendo sempre più importante la capacità di maneggiarli per estrarre informazioni utili.

Raccolta, analisi e visualizzazione dei dati stanno diventando strategiche per il professionista dell’informazione, ma anche per le aziende. Si sente sempre parlare di data journalism per definire la pratica di raccontare i fatti a partire dai dati e con modalità di visualizzazione innovative, ma poco si dice dei benefici di queste pratiche per le organizzazioni pubbliche e private. I dati sono il petrolio del nostro secolo, ma spesso nelle aziende complesse sono seppelliti in formati diversi e database non comunicanti.
Riuscire a metterli in relazione vuol dire guadagnare un importante vantaggio competitivo sul mercato., Inoltre in un momento in cui le aziende fanno fatica a stabilire un legame duraturo con i propri pubblici di riferimento, il data storytelling può essere una risorsa straordinaria di comunicazione. Amslaurea.unibo.it/3907/1/guadagnini_francesca_tesi.pdf. Gephi. Fabio Ruini's blog » Gephi e Social Network Analysis. Gephi, an open source graph visualization and manipulation software. Import Dynamic Data - Gephi:Wiki. Introduction Longitudinal Networks Longitudinal (also named dynamic) networks are simply network that evolve in time.
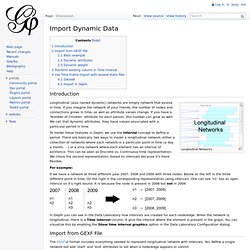
If you imagine the network of your friends, the number of nodes and connections grows in time, as well as attribute values change. If you have a 'Number of Children' attribute for each person, this number can grow as well. We call that dynamic attributes, they have values associated with a particular period in time. To model these features in Gephi, we use the Interval concept to define a period. For example: If we have a network at three different year 2007, 2008 and 2009 with three nodes. In Gephi you can see in the Data Laboratory how intervals are created for each node/edge. Import from GEXF File The GEXF format includes everything needed to represent longitudinal network with intervals. Basic example Below is our precedent example with three nodes from 2007 to 2009. Notice the following important points: Social Network Analysis. About the Course Everything is connected: people, information, events and places, all the more so with the advent of online social media.
A practical way of making sense of the tangle of connections is to analyze them as networks. In this course you will learn about the structure and evolution of networks, drawing on knowledge from disciplines as diverse as sociology, mathematics, computer science, economics, and physics. Online interactive demonstrations and hands-on analysis of real-world data sets will focus on a range of tasks: from identifying important nodes in the network, to detecting communities, to tracing information diffusion and opinion formation. Introduction to Network Visualization with GEPHI. New tutorial available!
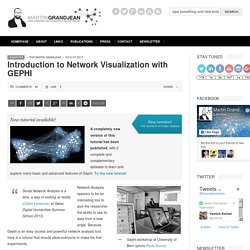
A completely new version of this tutorial has been published, with 2 complete and complementary datasets to learn and explore many basic and advanced features of Gephi: To the new tutorial Gephi workshop at University of Bern (photo Radu Suciu) Social Network Analysis is a lens, a way of looking at reality. (Claire Lemercier at Swiss Digital Humanities Summer School 2013) Network Analysis appears to be an interesting tool to give the researcher the ability to see its data from a new angle. I propose below, after a short introduction about the basis of SNA and some examples which shows the potential of this tool, a transcript of tutorial given during a workshop of the first Digital Humanities summer school in Switzerland (June 28. 2013), and kept up to date. 1.
A network consists of two components : a list of the actors composing the network, and a list of the relations (the interactions between actors). 2. 3. Commetrix - Dynamic Network Visualization Software - Dynamic Visualization of Networks - Dynamic Social Network Analysis Software Visualization - Dynamic Network Analysis - Virtual Communities. Orgnet, LLC - Social Network Analysis software & services for organizations, communities, and their consultants. Cytoscape App Store.