

Network Science Institute at Northeastern University. Guess the Correlation. Registration e-mail sent - viscovery.net. Untitled. IBM Watson News Explorer. Created by the Cognitive Visualization Lab.

SocioViz: un nuovo tool per la social network analysis. Editor - Argunet. Argunet Editor is a free argument map editor for analyzing and visualizing complex debates.
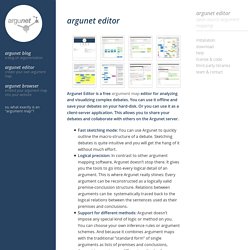
You can use it offline and save your debates on your hard-disk. Or you can use it as a client-server application. This allows you to share your debates and collaborate with others on the Argunet server. Fast sketching mode: You can use Argunet to quickly outline the macro-structure of a debate. Sketching debates is quite intuitive and you will get the hang of it without much effort.Logical precision: In contrast to other argument mapping software, Argunet doesn’t stop there.
If this all sounds like gibberish to you, don’t worry. Installation In order to run Argunet, a Java Runtime Environment 6.0 or higher has to be installed on your Computer. Please select the download files for your operations system below and follow the install instructions. To install the Argunet layout and export plugins open the ‘Help’ Menu in Argunet and select ‘Install Argunet plugins’. Download Microsoft Windows Mac OS X. Visual Thinking Center. News about Cayra. Mike Goodold (@GoodoldsOnTwitter) just commented at on my August 2010 post about Cayra that the developers hadn’t done a good job of specifying requirements.
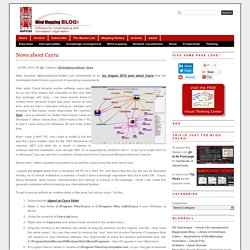
Well, sadly Cayra became orphan software years ago, so no one from Intalev, the originator of this nice little free package, will reply – I’ve tried several times to contact them because Cayra was open source at one time, and we had a volunteer willing to maintain and enhance it. But Intelev never responded. As I mention here, I saw a comment on Twitter that it doesn’t work on Windows 7. When I wrote that, I didn’t have a Win 7 PC to test it. I was using it on Windows XP and Vista at the time. Now I have a Win7 PC, and I tried to install it, but the way the Cayra installer tests for the .NET framework (it requires .NET 3.0) fails. Never mind – Mike’s question prompted me to look for a way round this and I found one. To get it running without an installer takes a little work, but not too much. Visual Thinking Center. Vision API - Image Content Analysis. Comprendi l'intera storia. L’iscrizione ti consente di accedere a diverse aree del Virtual Forum.
Scopri il programma! La Sala Plenaria Accedi a presentazioni ricche di approfondimenti dei principali esponenti nel campo delle analytics, oltre a un aggiornamento sulla strategia e alle release di prodotto più recenti di Qlik.La Discover Zone ti permette di partecipare ai forum di discussione dedicati, chat dal vivo con partner, clienti ed esperti di Qlik.Qlik Experience: Prodotti. Quest'area ti da accesso a tutte le informazioni relative all’intero mondo Qlik e ai suoi prodotti. Qlik Experience: Soluzioni. E' un’area interattiva che ti permette di accedere ad informazioni riguardanti le analisi di specifici settori e funzioni aziendali. Microsoft Project Oxford Emotion Demo. Open for Innovation. bCisiveOnline. TAGSExplorer: Interactively visualising Twitter conversations archived from a Google Spreadsheet.
Graphs can be a powerful way to represent relationships between data, but they are also a very abstract concept, which means that they run the danger of meaning something only to the creator of the graph.
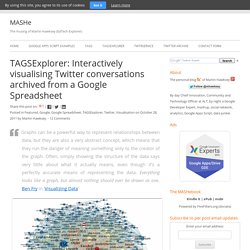
Often, simply showing the structure of the data says very little about what it actually means, even though it’s a perfectly accurate means of representing the data. Everything looks like a graph, but almost nothing should ever be drawn as one. Ben Fry in ‘Visualizing Data’ I got that quote from Dan Brickley’s post Linked Literature, Linked TV – Everything Looks like a Graph and like Dan I think Ben Fry has it spot on. When I started following Tony’s work on network analysis (here’s a starting point of posts), my immediate response was ‘Where’s Wally?’ As I start my exploration of tools like NodeXL it's very clear that being able to filter, probe and wander through the data provides far more insights to what’s going on.
But what does this graph actually mean? *** TAGSExplorer *** TruthMapping. Concept Mapping as a Tool for Group Problem Solving. Gapminder: Unveiling the beauty of statistics for a fact based world view.