SunsEnergyTemp. Sceptic-Ratio. Отступление ледников Килиманджароа. Климатическая катастрофа отменяется. Marian Koshland Science Museum. How do we know what the climate was like before recorded history?
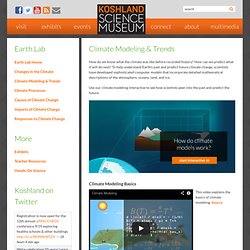
How can we predict what it will do next? To help understand Earth’s past and predict future climate change, scientists have developed sophisticated computer models that incorporate detailed mathematical descriptions of the atmosphere, oceans, land, and ice. Use our climate modeling interactive to see how scientists peer into the past and predict the future. Climate Modeling Basics This video explains the basics of climate modeling. Proxy Data Scientists compare today’s climate with that of the distant past using proxy data from tree rings, ice cores, and other indicators.
Temperature anomalies based on multiple sources of proxy data. Graph reconstructed from National Research Council (NRC). 2006. Larger Image Taken together, proxy data show that the past few decades were warmer than any other comparable period during at least the last 400 years, and possibly the last 1,000 years or longer. Tree Rings Ice Cores Corals. Earth Science Guy: Paleoclimate: A History of Change.
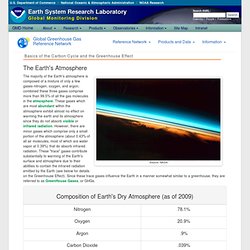
ESRL Global Monitoring Division - Global Greenhouse Gas Reference Network. The Earth's Atmosphere Source: NASA.
United States Carbon Cycle Science Program. What is the Carbon Cycle? What is the science behind it? What is the carbon cycle?
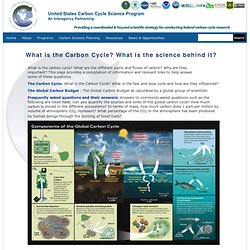
What are the different pools and fluxes of carbon? Why are they important? Tipping Elements - the Achilles Heels of the Earth System — PIK Research Portal. Tipping elements are components of the Earth System that are sub-continental in scale and could be tipped into qualitatively different states by small external perturbations.
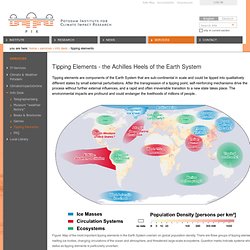
After the transgression of a tipping point, self-reinforcing mechanisms drive the process without further external influences, and a rapid and often irreversible transition to a new state takes place. The environmental impacts are profound and could endanger the livelihoods of millions of people.. Figure: Map of the most important tipping elements in the Earth System overlain on global population density. Education - Multimedia Discovery Missions. The Multimedia Discovery Mission Demos are a series of 14 interactive multimedia presentations and learning activities that address topics ranging from Chemosynthesis and Hydrothermal Vent Life and Deep-sea Benthos to Food, Water and Medicine from the Sea.
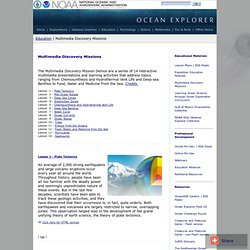
Credits. Lesson 1 - Plate Tectonics Lesson 2 - Mid-Ocean Ridges Lesson 3 - Deep-Sea Corals Lesson 4 - Subduction Zones Lesson 5 - Chemosynthesis and Hydrothermal Vent Life Lesson 6 - Deep-Sea Benthos Lesson 7 - Water Cycle Lesson 8 - Ocean Currents Lesson 9 - Ocean Waves Lesson 10 - Tides Lesson 11 - Energy from the Oceans Lesson 12 - Food, Water, and Medicine from the Sea Lesson 13 - Hurricanes Lesson 14 - Seamounts An average of 2,000 strong earthquakes and large volcanic eruptions occur every year all around the world. Throughout history, people have been all too familiar with the deadly power and seemingly unpredictable nature of these events. Click here for HTML version. Causes of Climate Change. Key Points Both natural and human factors change Earth’s climate.
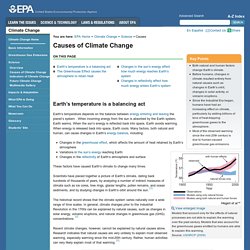
Before humans, changes in climate resulted entirely from natural causes such as changes in Earth’s orbit, changes in solar activity, or volcanic eruptions.
Dynamic equilibrium. Wind & water. G.U.N.T. - Equipment for engineering education - Environment. Teaching and Research Systems in Environmental Engineering Roughly three-quarters of the Earth's surface is covered by oceans.
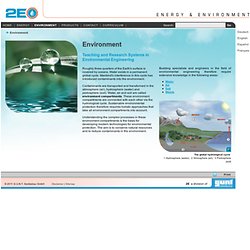
Water exists in a permanent global cycle. Mankind's interference in this cycle has introduced contaminants into the environment. Contaminants are transported and transformed in the atmosphere (air), hydrosphere (water) and pedosphere (soil). Water, air and soil are called environment compartments. Understanding the complex processes in these environment compartments is the basis for developing modern technologies for environmental protection. Cartoon Climate Change page notes : Stand-Up Economist. Part 4—Use ANDRILL Animation to Simulate Climate Conditions. Step 1 – Locate the ANDRILL drill site in on the map of Antarctica Examine the map of research sites in Antarctica during the 2006-2007 season.
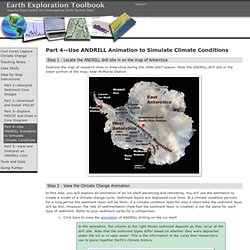
Note the ANDRILL drill site in the lower portion of the map, near McMurdo Station. Step 2 – View the Climate Change Animation In this step, you will explore an animation of an ice shelf advancing and retreating. You will use the animation to create a model of a climate change cycle. Climate Forcing Factors. Holistic Lifestyle Community Blog: Climate Change: Causes and Effects. This post is a discussion of how the climate can change.

For general discussion of the current change in Earth's climate, see post Global Warming: Planet in Peril? "Weather can be hot or cold, dry or wet, calm or stormy, clear or cloudy. Climate is the average weather in a place over a long period of time. Changes in climate may be due to natural forces or from human activities. Today climate changes are happening at an increasingly rapid rate. HotWhopper: Unbalanced at WUWT: Earth's Energy Budget. This week WUWT's Serengeti Strategy is aimed fairly and squarely at Kevin Trenberth.
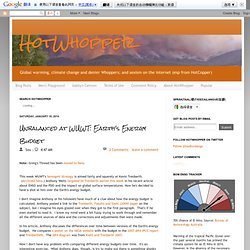
(Archived here.) Anthony Watts targeted Dr Trenberth earlier this week in his recent article about ENSO and the PDO and the impact on global surface temperatures. Now he's decided to have a shot at him over the Earth's energy budget. I don't imagine Anthony or his followers have much of a clue about how the energy budget is calculated. Anthony posted a link to the Trenberth, Fasullo and Kiehl (2009) paper on the subject, but I imagine his eyes glazed over when they got to the first paragraph. In his article, Anthony discusses the differences over time between versions of the Earth's energy budget. Now I don't have any problem with comparing different energy budgets over time. Earth Gauge » Climate Video. Earth Gauge visuals and video clips may be freely used on-air, online, in community outreach and in educational settings.
If you have questions, please contact us. Graphics & Visuals: Still graphics available in web and broadcast resolution. Is the CO2 effect saturated? The mistaken idea that the Greenhouse Effect is 'saturated', that adding more CO2 will have virtually no effect, is based on a simple misunderstanding of how the Greenhouse Effect works. The myth goes something like this: CO2 absorbs nearly all the Infrared (heat) radiation leaving the Earth's surface that it can absorb. True! Therefore adding more CO2 won't absorb much more IR radiation at the surface.
True! Here's why; it ignores the very simplest arithmetic. Climate-Change. CMMAP. A Brief History of Atmospheric Carbon Dioxide Record-Breaking. Guest Post by David Middleton The World Meteorological Organization (Why do I always think of Team America: World Police whenever “World” and “Organization” appear in the same title?) Recently announced that atmospheric greenhouse gases had once again set a new record.
Greenhouse gases reach another new record high! Records are made to be broken. Temp Readings: Ice Core/Other Proxy Data. Read here and here. This image, which became the favored icon of global-warmists, has taken on a life-of-its-own during the past decade. The hockey-stick icon has already cost taxpayers billions of dollars and has the potential to cost taxpayers and consumers trillions more. When Michael Mann created the temperature dataset that the hockey-stick graph is based on, little did he realize that trillions were at stake, or that he would unleash a science-fraud investigation sunami that now threatens to legally engulf him.
(click on images to enlarge) Nine Facts about Climate Change. [Originally published in November 2006 as a PDF (click here, 1.5 Mb). Launched in Canberra by Sir Arvi Parbo on 28 February 2007] Introduction In January 2006 I wrote a pamphlet entitled Nine Lies about Global Warming in which I sought to summarise for the lay reader the state of the debate about increasing atmospheric concentrations of carbon dioxide, and the widespread predictions of catastrophic global warming which would ensue as a consequence of man's use of fossil fuels. Despite the inherent scientific implausibility of these predictions, and the complete lack of empirical evidence to support them, a number of current political leaders and former leaders, notably UK Prime Minister Tony Blair, former US Vice President Al Gore and Australian Labor Leader Kim Beazley, have embraced these predictions. NOAA Paleoclimatology Program - Perspective on Abrupt climate Change. KCVS -Global Climate Change.
Climate Science Info Zone. The Earth-Atmosphere Energy Balance. NASA Earth Observatory : Home. Causes. Greenhouse Gases: Introduction. IntroductionWater VaporCO2CH4OzoneN2OCFCsCOAdditional Information. Global Warming: Man or Myth - Determining the Climate Record. The Grand View: 4 Billion Years Of Climate Change. The Carbon Dioxide Problem. Climate Change - Global Warming - Do Climates Change? Dynamics of gas hydrates in polar environments. The Arctic is a region that is particularly sensitive to climate change. Most climate models predict a rapid increase in Arctic air and surface water temperature over the coming decades. We already know that over the past decade, the Arctic has been warming up twice as fast as the global average. Paleoclimatology Data. Paleoclimatology data are derived from a wide variety of natural sources such as tree rings, ice cores, corals, and ocean and lake sediments.
Paleoclimatology data are derived from natural sources such as tree rings, ice cores, corals, and ocean and lake sediments. Climate Change. SMART2 (Simulation Model for Acidification's Regional Trends) Nitrogen Cycle.