
How to Study Smart not Hard. Why is it that some students study really hard, but aren’t the best in their age group or get “only” average grades?

And why is it that there are other students who do not even invest half the amount of time and effort into their studies, but get good or even outstanding results? Intelligence certainly plays a role. But: The way you study can make or break your success at school/college/university. My recommendation is to study smart, which can help you to save a lot of time that would have been lost with unfocused attempts of “studying hard”. This article is, however, not intended as an excuse for students not to study at all. When I started studying, I was shocked to see many of my fellow students rushing into the library only to leave with seven or more books in their hands.
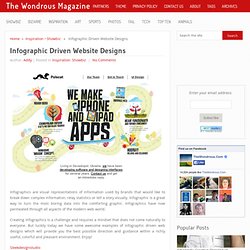
Infographic Driven Website Designs. Infographics are visual representations of information used by brands that would like to break down complex information, relay statistics or tell a story visually.

Infographic is a great way to turn the most boring data into the comforting graphic. Infographics have now permeated through all aspects of the modern web world. Creating infographics is a challenge and requires a mindset that does not come naturally to everyone. But luckily today we have some awesome examples of infographic driven web designs which will provide you the best possible direction and guidance within a richly useful, colorful and pleasant environment. Enjoy! Sleekdesignstudio Urbaneo Melonfree Lugin Clayant Mintdigital. Visual Dictionary. Learning Resources in Delicious Blog Form. How will you obtain a higher education?

Some major headlines in 2009 already play on the fears about how to pay for a higher education. Press releases from colleges want to quell those fears about monies for college, and politicians have introduced legislation to make education more affordable. The desire to lure students into college is strong across the globe, and many colleges have learned that education no longer belongs to a select few who can afford a degree. “Flat education,” or education provided for the masses via the Internet has become commonplace over the past few years, and open courseware projects abound on the Web. [click to continue…] Petite USB drives, already handy for carrying data, are becoming more useful and powerful.
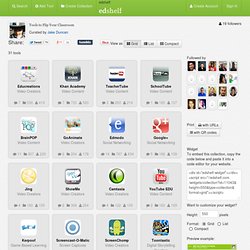
Video collections can offer hours of entertainment, but they also can provide users with hours of education. Are you sad that you have an Android phone instead of an iPhone because of the lack of apps? Vocalizer 5 - Interactive Demo. The Tools to Flip Your Classroom Collection by Jake Duncan. Edshelf Tools to Flip Your Classroom Curated by Jake Duncan Share: 19 followers 31 tools View as Grid List Compact Educreations Video Creators Khan Academy Video Content TeacherTube Video Content SchoolTube Video Content BrainPOP Video Content GoAnimate Video Creators Edmodo Social Networking Google+ Social Networking.

Excellent Tools for Creating Videos Without Installing Software. Over the years I've published some lists and reviews of free tools for creating videos online.

Quite a few of those tools have been for creating simple videos that are really just automated, audio slideshows. See Animoto for an example of this. There's nothing inherently wrong with having your students use those tools, but at some point you will want to take your video projects to the next level. These are the five tools that I recommend for creating and editing videos without installing any special software. Pixorial is the online video creation tool that I hear teachers talking about a lot lately. WeVideo is a collaborative online video creation tool. PowToon is a nice service for creating explanatory videos through a drag and drop process. Best Websites for Teaching & Learning 2013. Technology and Education.
Visual Thinking Center. The 36 best tools for data visualization. It's often said that data is the new world currency, and the web is the exchange bureau through which it's traded.

As consumers, we're positively swimming in data; it's everywhere from labels on food packaging design to World Health Organisation reports. As a result, for the designer it's becoming increasingly difficult to present data in a way that stands out from the mass of competing data streams. Get Adobe Creative Cloud One of the best ways to get your message across is to use a visualization to quickly draw attention to the key messages, and by presenting data visually it's also possible to uncover surprising patterns and observations that wouldn't be apparent from looking at stats alone. And nowadays, there's plenty of free graphic design software to help you do just that. As author, data journalist and information designer David McCandless said in his TED talk: "By visualizing information, we turn it into a landscape that you can explore with your eyes, a sort of information map.