
Дивиденды российских компаний, выплаты дивидендов, даты закрытия реестра, доход дивиденды, дивидендные акции, даты отсечки. Finance - What data sources are available online? I don't know how interested you are in the CME data, but I have been learning about options and volatility modeling.
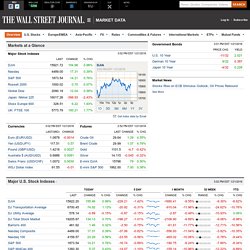
I have been working with delayed CME data. I have been able to extract the JSON queries and now have been able to run them in my .NET application to get data for every asset type. Exmaple of ES options data: Run the query below in Chrome and you will see the JSON response. In other browsers you will be prompted to download the JSON file. The link below asks CME server to return back options data for given strikes: Рутикер. FootPrint и Анализ Объемов московской биржи. S&P 500® - S&P Dow Jones Indices. Stock Market Data & Financial Markets Summary - Wall Street Journal. Leading Groups % chg Coal 15.95% Pipelines 9.53% Aluminum 4.94% Farming & Fishing 4.66% Exploration & Production 4.35% Lagging Groups % chg Railroads -1.99% Mortgage Finance -1.63% Distillers & Vintners -1.49% Investment Services -1.26% Biotechnology -1.12% Direxion:Nat Gas Bull 3X (GASL) Direxion:Ntrl Gs Rl Br3X (GASX)
S&P 500 Index - CNNMoney.com. Backtest ETF Portfolio. Assetcorrelation. PerfCharts. Note: Initially this chart has the S&P 500 as its "baseline.
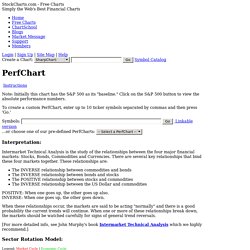
" Click on the S&P 500 button to view the absolute performance numbers. To create a custom PerfChart, enter up to 10 ticker symbols separated by commas and then press 'Go.' Interpretation: Intermarket Technical Analysis is the study of the relationships between the four major financial markets: Stocks, Bonds, Commodities and Currencies. There are several key relationships that bind these four markets together. The INVERSE relationship between commodities and bonds The INVERSE relationship between bonds and stocks The POSITIVE relationship between stocks and commodities The INVERSE relationship between the US Dollar and commodities POSITIVE: When one goes up, the other goes up also. When these relationships occur, the markets are said to be acting "normally" and there is a good probability the current trends will continue.
[For more detailed info, see John Murphy's book Intermarket Technical Analysis which we highly recommend.] Portfolio Visualizer. Asset Allocation Website. The content provided on this website is only informational and is not investment advice or any offer or sale of any investments.
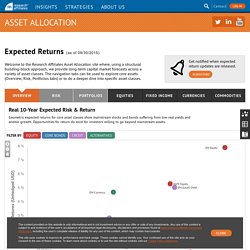
Any use of this content is subject to and evidence of the user's acceptance of all important legal disclosures, disclaimers and provisions found at www.researchaffiliates.com/pages/legal.aspx, including the user’s complete release of liability for any use of the content, which may contain inaccuracies. This site uses cookies to improve its performance and track usage. These cookies cannot identify you. Your continued use of this site acts as your consent to the use of these cookies. To learn more about cookies or to use the site without cookies visit our Cookie Policy Statement. S&P 500 PE Ratio.
Stock Quotes, Stock Charts, and Stock Research. Article Archive - #MaCa.com #MaCa.com. Yahoo Finance - Business Finance, Stock Market, Quotes, News. FINVIZ.com - Stock Screener. Global Stock Market Valuation Ratios (Shiller PE, CAPE, PB...) Over the past 100 years, equity investors have managed to generate real capital growth of about 6 percent annually.
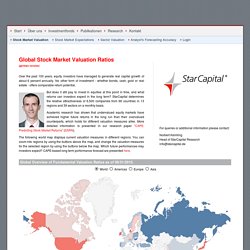
No other form of investment - whether bonds, cash, gold or real estate - offers comparable return potential. But does it still pay to invest in equities at this point in time, and what returns can investors expect in the long term? StarCapital determines the relative attractiveness of 6,500 companies from 66 countries in 13 regions and 39 sectors on a monthly basis. Academic research has shown that undervalued equity markets have achieved higher future returns in the long run than their overvalued counterparts, which holds for different valuation measures alike. More detailed information is presented in our research paper "CAPE: Predicting Stock Market Returns" (SSRN). The following world map displays current valuation measures in different regions. For queries or additional information please contact: Stock Screener. Fear & Greed Index - Investor Sentiment.
Bloomberg - Stock Market & Financial Markets Overview. REUTERS - Stock Screener. A blend of growth and value strategy seeks to identify growth stocks that are valued fairly.
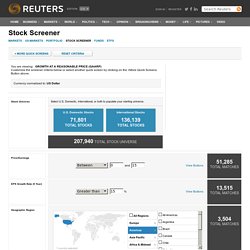
Screen Criteria P/E Ratio, PEG Ratio, EPS Growth Rate (5 Year), Country Name. This screen returns large caps from every market that have a low forward P/E Ratio as well as historically high earnings per share growth rates. Market Cap - Large, 1 Year Forward P/E Ratio, PEG Ratio, EPS Growth Rate (5 Year). This screen returns only those US based small cap companies with high EPS growth rates. Market Cap - Small, P/E Ratio, Country Name. Identify all companies classified locally as Small Cap that returned EPS growth rates in the highest 20% in their local market as well as an historical EPS growth rate of greater than 20%. Market Cap - Small, EPS Growth Rate (5 Year). US listed companies that traded within 1% of their 52 week high as of close of the most recent session.
Market Cap - Small, Percentage away from the 52 Week High, Country Name. REUTERS - Fund & ETF Screener.