
Startup Funding Shows Signs of New Tech Bubble. Over the past few days two venture capitalists in the United States have expressed their worries about the current state of the US startup community.

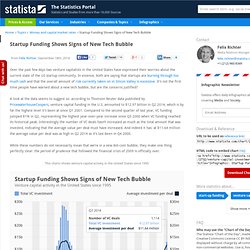
In essence, both are saying that startups are burning through too much cash and that the overall amount of risk currently taken on in Silicon Valley is excessive. It’s not the first time people have warned about a new tech bubble, but are the concerns justified? A look at the data seems to suggest so: according to Thomson Reuter data published by PricewaterhouseCoopers, venture capital funding in the U.S. amounted to $12.97 billion in Q2 2014, which is by far the highest level it’s been at since Q1 2001. Compared to the second quarter of last year, VC funding jumped 81% in Q2, representing the highest year-over-year increase since Q3 2000 when VC funding reached its historical peak. This charts shows venture capital activity in the United States since 1995. Europe is Highly Dependent on Russian Gas.
The United States is increasing pressure on European leaders to impose further sanctions on Russia in the wake of the downing of Malaysia Airlines flight MH17.

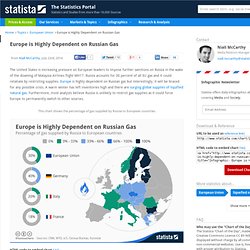
Russia accounts for 30 percent of all EU gas and it could retaliate by restricting supplies. Europe is highly dependent on Russian gas but interestingly, it will be braced for any possible crisis. A warm winter has left inventories high and there are surging global supplies of liquified natural gas. Furthermore, most analysts believe Russia is unlikely to restrict gas supplies as it could force Europe to permanently switch to other sources. This chart shows the percentage of gas supplied by Russia to European countries. <a href=" title="Infographic: Europe is Highly Dependent on Russian Gas | Statista"><img src=" alt="Infographic: Europe is Highly Dependent on Russian Gas | Statista" style="width: 100%; height: auto ! Men & Women's Spending Habits Compared. The battle of the sexes continues it seems.

We look through a ton of infographics here at Bit Rebels, and there is always one or two that compare women to men in some way or another. Usually it’s about some kind of habit, and that is what we are going to look at today. As the world gets ever more expensive to live in, it’s only natural that someone is sooner or later going to look at our spending habits, especially when it comes to how women and men spend money. At some point in your life, you have probably tried to figure out where all that hard earned money goes, and what it is that you actually spend it on. Furthermore, it’s probably not too hard to imagine that you have wondered if your spending habits are different from other people’s, right? One of the things that stands out is that women are more likely to indulge in retail therapy to boost their mood. Via: [visual.ly] Social Media Increases Online Use As Traditional Media Suffers. Last year, the person beside you and the one you look at the mirror every day spent 3 hours and 7 minutes online for social media on a daily basis.

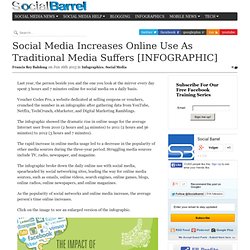
Voucher Codes Pro, a website dedicated at selling coupons or vouchers, crunched the number in an infographic after gathering data from YouTube, Netflix, TechCrunch, eMarketer, and Digital Marketing Ramblings. The infographic showed the dramatic rise in online usage for the average Internet user from 2010 (2 hours and 34 minutes) to 2011 (2 hours and 56 minutes) to 2012 (3 hours and 7 minutes). The rapid increase in online media usage led to a decrease in the popularity of other media sources during the three-year period.
Struggling media sources include TV, radio, newspaper, and magazine. As the popularity of social networks and online media increase, the average person’s time online increases.
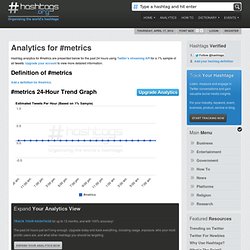
Trends. Metrics. Hashtag analytics for #metrics are presented below for the past 24 hours using Twitter's streaming API for a 1% sample of all tweets.

Upgrade your account to view more detailed information. Definition of #metrics Add a definition for #metrics. #metrics 24-Hour Trend Graph Analytics Expand Your Analytics View Track your hashtags for up to 12 months, and with 100% accuracy! The past 24 hours just isn't long enough. Expand Your Analytics Now. G-metrics for creating stat with Google queries.