

optionstrategies
At Option Strategies insider, we believe in a better way to trade options. A superior strategy and a more profitable way for traders to grow their portfolio every month. We are obsessively passionate about what we do and our mission is to help others achieve similar success. We focus on combining quality research with market conditions and volatility. This is one of the rarest approaches to the market, and it gives us a superior opportunity: We are excited to simplify option trading for everyone through our education, research, and community.
Bear Put Spread Option Strategy. Butterfly Spread with Puts Option Strategy. A long butterfly spread with puts is an advanced options strategy that consists of three legs and four total options.

The trade involves buying one put at strike price A, selling two puts and strike price B and then buying one put at strike price C. What Is Implied Volatility in Options Trading? - Option Strategies Insider. Implied volatility (IV) is one of the most important yet least understood aspects of options trading as it represents one of the most essential ingredients to the option pricing model.

Implied volatility indicates the chances of fluctuation in a security’s price. It also helps investors calculate the probability of the price of a stock reaching a given mark during a specific time frame. The difference between implied and historical volatility is that historical volatility, or realized volatility, is the analyzed standard deviation of stock price movements, while IV is based on the option’s price and expected future volatility. Representation of Implied Volatility Implied volatility is usually represented as a percentage indicating the expected standard deviation range.
To understand SD ranges for IV, let’s consider the following example. Calculation of Implied Volatility Different methods are used to determine implied volatility. Video Explaining How To Profit When Volatility Increases. What is Implied Volatility and Why is it Important in Option Trading? Long Put Option Strategy - Option Strategies Insider. The long put options trading strategy offers an individual the right to sell an underlying stock at the specified price, point A, as listed on the graph.

When the investor purchases a put option, he or she is betting that the stock will fall below the strike price before the expiration date. Using a put instead of shorting the stock reduces the risk to the investor as they can only lose the cost of the put, verses unlimited risk associated with shorting the stock. If the stock rises, the long put option will expire worthless, and the investor will lose only the cost of the option. Likewise, an investor who shorted the stock will continue to lose more and more as the stock continues to climb higher. When purchasing puts, especially short term, there is a need for investors to be careful. When to Buy Put Options There are many reasons to buy put option contracts, these can be for speculative purposes, meaning the investor believes a stock price is going to fall. Buying a Put vs. Breakeven. How the Double Top Pattern Works. Double Top Pattern Trading - Option Strategies Insider. Covered Call Option Strategy.
Covered Call Option Strategy. Covered Call. Descending Triangle Pattern - Option Strategies Insider. The descending triangle pattern is a popular bearish continuation pattern that is created by drawing a horizontal line that connects low points and a trend line that connects lower highs.
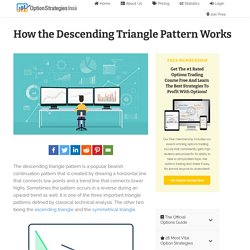
Sometimes the pattern occurs in a reverse during an upward trend as well. It is one of the three important triangle patterns defined by classical technical analysis. How the Ascending Triangle Pattern Works. Explaining BTFD and STFR in the Simplest Way I Can. I might want to take second to teach the majority on these two footing.
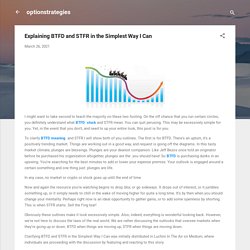
On the off chance that you run certain circles, you definitely understand what BTFD stock and STFR mean. You can quit perusing. This may be excessively simple for you. Yet, in the event that you don't, and need to up your entire look, this post is for you. To clarify BTFD meaning and STFR I will show both of you outlines.
In any case, no market or crypto or stock goes up until the end of time. Now and again the resource you're watching begins to drop, blur, or go sideways. Obviously these outlines make it look excessively simple. Clarifying BTFD and STFR in the Simplest Way I Can was initially distributed in Luchini In The Air on Medium, where individuals are proceeding with the discussion by featuring and reacting to this story. Explaining BTFD and STFR in the Simplest Way I Can. Explaining BTFD and STFR in the Simplest Way I Can. I might want to take second to teach the majority on these two footing.
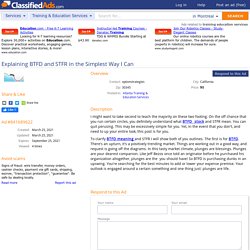
On the off chance that you run certain circles, you definitely understand what BTFD stock and STFR mean. You can quit perusing. This may be excessively simple for you. Yet, in the event that you don't, and need to up your entire look, this post is for you. To clarify BTFD meaning and STFR I will show both of you outlines. How the Cup and Handle Pattern Works. A and handle design happens when the basic resource frames a diagram that looks like a looking like a U, and a cup and handle addressed by a slight descending pattern after the . cup and handle pattern The shape is framed when there's a value wave down, which is then trailed by an adjustment period, followed again by a convention of around a similar size as the earlier pattern.
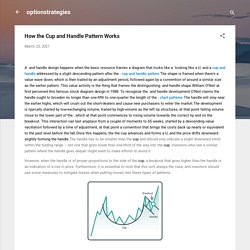
This value activity is the thing that frames the distinguishing and handle shape.William O'Neil at first perceived this famous stock diagram design in 1988. However, when the handle is of proper proportions to the side of the cup, a breakout that goes higher than the handle is an indication of a rise in price. Furthermore, it is essential to note that this isn’t always the case, and investors should use some measures to mitigate losses when putting money into these types of patterns. How the Cup and Handle Pattern Works. How the Cup and Handle Pattern Works. Stock Chart Patterns. Stock Chart Patterns. “” Stock chart patterns”” can be a vital tool for investors.

They provide an exceptionally detailed level of a stock’s trend lines. This can give a major leg up against the competition. This is why they are used by the likes of retail investors, billion-dollar hedge funds and everyone in between. Basically, “” stock market patterns”” are a way to view the ups and downs of a stock’s price over the course of time… and then use that information to help predict future movement. They can be a micro-analysis of a single day’s worth of trading. It is ok to contact this poster with commercial interests. Short Call Option Strategy. The short call option strategy, also known as uncovered or naked call, consist of selling a call without taking a position in the underlying stock.
For those who are new to options, they should avoid the short call option as it is a high-risk strategy with limited profits. More advanced traders use a short call to profit from unique situations where they receive a premium for taking on risk. How the Inverse Head and Shoulders Pattern Works. Stock Chart Patterns. Stock Chart Patterns. Stock Chart Patterns. Options Trading Strategies. Options trading strategies alternatives are contingent subordinate agreements that permit purchasers of the agreements (choice holders) to purchase or sell a security at a picked cost.
Choice purchasers are charged a sum called a "premium" by the merchants for a right. Options strategies Should showcase costs be horrible for alternative holders, they will allow the choice to lapse useless, hence guaranteeing the misfortunes are not higher than the premium. stock patterns Conversely, alternative dealers (choice essayists) accept more serious danger than the choice purchasers, which is the reason they request this option premium.
Choices are partitioned into "call" and "put" choices.