

Clique (graph theory) A graph with 23 1-vertex cliques (its vertices), 42 2-vertex cliques (its edges), 19 3-vertex cliques (the light and dark blue triangles), and 2 4-vertex cliques (dark blue areas).
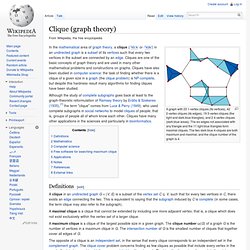
The six edges not associated with any triangle and the 11 light blue triangles form maximal cliques. The two dark blue 4-cliques are both maximum and maximal, and the clique number of the graph is 4. A maximal clique is a clique that cannot be extended by including one more adjacent vertex, that is, a clique which does not exist exclusively within the vertex set of a larger clique. Mathematical results concerning cliques include the following. Several important classes of graphs may be defined by their cliques: Additionally, many other mathematical constructions involve cliques in graphs. Free software for searching maximum clique[edit] Complete bipartite graph.
Graph theory itself is typically dated as beginning with Leonhard Euler's 1736 work on the Seven Bridges of Königsberg.
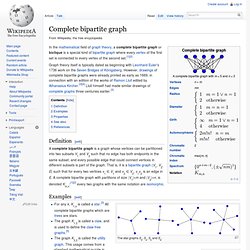
However, drawings of complete bipartite graphs were already printed as early as 1669, in connection with an edition of the works of Ramon Llull edited by Athanasius Kircher.[3][4] Llull himself had made similar drawings of complete graphs three centuries earlier.[3] Definition[edit] Power graph analysis. Hypergraphs are a generalization of graphs in which edges are not just couples of nodes but arbitrary n-tuples.
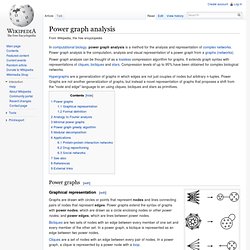
Power Graphs are not another generalization of graphs, but instead a novel representation of graphs that proposes a shift from the "node and edge" language to an using cliques, bicliques and stars as primitives. Power graphs[edit] The primitive motifs used for power graph analysis and their corresponding diagrammatic representation: biclique, clique and star.
Graphical representation[edit] Graphs are drawn with circles or points that represent nodes and lines connecting pairs of nodes that represent edges. Bicliques are two sets of nodes with an edge between every member of one set and every member of the other set. Ad hoc. Ad hoc is a Latin phrase meaning "for this".
It generally signifies a solution designed for a specific problem or task, non-generalizable, and not intended to be able to be adapted to other purposes. Common examples are organizations, committees, and commissions created at the national or international level for a specific task. In other fields the term may refer, for example, to a military unit created under special circumstances, a tailor-made suit, a handcrafted network protocol, or a purpose-specific equation.
Ad hoc can also mean makeshift solutions, shifting contexts to create new meanings, inadequate planning, or improvised events. Ad hoc hypothesis[edit] In science and philosophy, ad hoc means the addition of extraneous hypothesis to a theory to save it from being falsified. Ad hoc military[edit] In military, ad hoc units are created during unpredictable situations, when the cooperation between different units is needed for fast action.
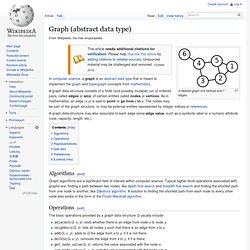
Graph (abstract data type) A labeled graph of 6 vertices and 7 edges.
A graph data structure may also associate to each edge some edge value, such as a symbolic label or a numeric attribute (cost, capacity, length, etc.). Graph algorithms are a significant field of interest within computer science. Typical higher-level operations associated with graphs are: finding a path between two nodes, like depth-first search and breadth-first search and finding the shortest path from one node to another, like Dijkstra's algorithm. A solution to finding the shortest path from each node to every other node also exists in the form of the Floyd–Warshall algorithm.
The basic operations provided by a graph data structure G usually include: Structures that associate values to the edges usually also provide: get_edge_value(G, x, y): returns the value associated to the edge (x,y).set_edge_value(G, x, y, v): sets the value associated to the edge (x,y) to v. Different data structures for the representation of graphs are used in practice: Graph rewriting. Graph transformations can be used as a computation abstraction.
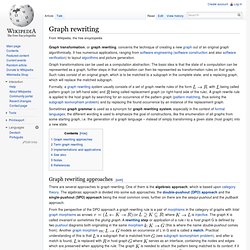
The basic idea is that the state of a computation can be represented as a graph, further steps in that computation can then be represented as transformation rules on that graph. What is Mind Mapping? (and How to Get Started Immediately) A mind map is a graphical way to represent ideas and concepts.

It is a visual thinking tool that helps structuring information, helping you to better analyze, comprehend, synthesize, recall and generate new ideas. Just as in every great idea, its power lies in its simplicity. In a mind map, as opposed to traditional note taking or a linear text, information is structured in a way that resembles much more closely how your brain actually works. Since it is an activity that is both analytical and artistic, it engages your brain in a much, much richer way, helping in all its cognitive functions. And, best of all, it is fun! So, how does a mind map look like? (click for larger image) This is a mind map about – conveniently enough – mind mapping itself. Benefits and Uses I think I already gave away the benefits of mind mapping and why mind maps work.
But what can we use mind maps for?