
Infographics. QR Code Generator. Book Free Vector Art - (19,857 Free Downloads) Worth Every Cent and More MEDIA RELEASE 0. Avatar Maker - Create Your Own Avatar Online. How to Choose the Best Charts for Your Infographic. One of the most important steps in creating infographics is choosing the right charts to tell your story.
How do you pick the best charts to represent your data in a unique and eye-catching way to successfully deliver your message? What are the techniques you can use to visualize your information so that your data speaks for itself? Here are some tried and true tips from the frontlines: 1. Creative and free PowerPoint templates - Showeet. Free Infographic Powerpoint Template - PPT Presentation Theme. What do you think of this free presentation?
Description: An infographic Powerpoint template with high-quality elements to create beautiful and stand out presentations. The best infographic tools from around the web. Infographic makers will enable you to transform mountains of data into easy-to-read visuals. Information is much more accessible when presented in a well-designed infographic rather than dense reams of data, so people are likely to be much more engaged with the subject. However, it can be time-consuming to put them together. Plagiarism Infographic - General guide for Referencing and avoiding plagiarism - Research/Subject Guides at AIT Library.
10 Popular Infographic Layout Templates Making You Inspired. How to lay out infographics like a pro?
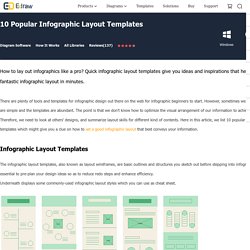
Quick infographic layout templates give you ideas and inspirations that help you design fantastic infographic layout in minutes. There are plenty of tools and templates for infographic design out there on the web for infographic beginners to start. However, sometimes we are still lost even the tools are simple and the templates are abundant.
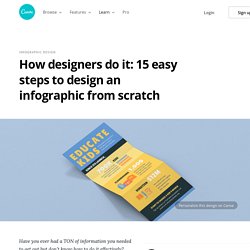
The point is that we don't know how to optimize the visual arrangement of our information to achieve the best looking effects. Therefore, we need to look at others' designs, and summarize layout skills for different kind of contents. Basic Rules in Designing Professional Infographic Layouts. The Infographic Design Cheat Sheet: 5 Layouts That'll Make Your Life Easier [Free Templates] Infographics have become one of the most powerful tools in a marketer's arsenal.
![The Infographic Design Cheat Sheet: 5 Layouts That'll Make Your Life Easier [Free Templates]](http://cdn.pearltrees.com/s/pic/th/infographic-layouts-templates-199353429)
Content marketers often find themselves wanting to explain complex topics to their audience in a way that's easy to understand. Layout Cheat Sheet for Infographics : Visual arrangement tips. This is part of our series on infographic design. Check out the other posts here! Good visual arrangement for infographics is putting together graphic and visual elements in a manner that draws your reader’s attention. The key to achieving simple, elegant and attractive content are ample whitespace and a well arranged layout. White space is as its name suggests – space that is unmarked in a piece of infographic or visual representation.
It could be margins, padding, or the space between columns, text, and icons and design elements. Whitespace matters in creating visually engaging content A page crammed full of text and images will appear busy. Using Whitespace for Clean and Uncluttered Infographic Design. CompleteGuideToInfographics. The Ultimate Infographic Design Guide - 13 Easy Design Tricks. How designers do it: 15 easy steps to design an infographic from scratch – Learn. Have you ever had a TON of information you needed to get out but don’t know how to do it effectively?
Fret no longer. Today you will learn how to relay mass amounts of information in an effective, beautiful way. That’s right, we’re talking infographics. You may be asking yourself, ‘what is an infographic?’ , and the answer is pretty simple. People are visual. This holds true online as well. 13 Types of Infographics: Which Works For You? Libraries matter: 18 fantastic library infographics and charts.
Library infographics presented below clearly show that being a librarian today is not about surviving any longer.
It’s great that such infographics are created. Infographics are a fantastic way to draw attention of online users, and give facts not only in a more digestible, but also highly entertaining way. Many people still perceive libraries as awesome-looking magical places, full of a scent of old paper. We associate libraries with the past and with the analog world – the world that doesn’t fit into the broadband internet connection. It’s not true (and I think it never was). These infographics change the perspective. Click or tap on the infographics to enlarge them. Research Process Infographic – library.trocaire.edu. Librarian Design Share – inspiration for library creatives. Library and Archives Fun Facts. Australian Council for Educational Research (ACER) Bad Infographics: 11 Mistakes You Never Want to Make. In an increasingly visual world, bad infographics have become the bane of the Internet. Just ask users who are bombarded on a daily basis with everything from poorly designed visuals to flat-out inaccurate data visualizations.
This pandemic has gotten so bad that up to 95% of infographics from unknown sites have distorted the truth or just plain lied. It’s ruining the Web--so much so that users have gotten better and better at spotting misleading data as soon as they see it. The Rise of Bad Infographics. Given the ubiquity of infographics on the web today (according to one account they have increased 1200% in three years), you can be forgiven for thinking that they are a new phenomenon.

They aren’t. Infographics have actually been around for quite some time, as Edward Tufte pointed out with his popularization of one of the best infographics of all time (see pic and link): Charles Joseph Minard’s portrayal of the losses suffered by Napoleon’s army in the Russian campaign of 1812. Go ahead and take a look. Study it. I’ll be here when you get back. Free Infographic Maker. Adding a logo to your content means your brand will be recognized anywhere you share or embed it.
The Infogram logo will automatically appear at the bottom of all projects created with our Basic and Pro plans. However, with the Business, Team, and Enterprise plans, you can disable Infogram branding and upload your own logo, if necessary. Designing Effective Infographics. As the ways we collect data and the tools we use to analyze it evolve, our world is becoming incredibly data-rich.
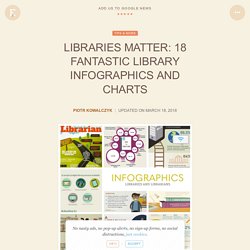
One of the most exciting challenges designers face in an increasingly quantitative world is how to translate data into a medium that is easily understood by a wide audience. Information graphics (better known as infographics) are a powerful storytelling tool that allows users to comprehend, analyze, and explore data. The hope of social-media sharing has made infographics popular on websites that emphasize content marketing. The distinction between data visualizations and information graphics is subtle, but important. Infographics often contain data visualizations, but a data visualization on its own is not an infographic. How To Design Your Own Infographics. Infographic Design & Content Marketing. 7 Common Types of Infographics. How to Create Infographics in Under an Hour [15 Free Infographic Templates]
Wouldn't it be great if creating infographics was as simple as writing regular old text-based blog posts?
![How to Create Infographics in Under an Hour [15 Free Infographic Templates]](http://cdn.pearltrees.com/s/pic/th/create-infographic-templates-171117666)
Unfortunately, making visual content like this usually takes a lot more time, effort, and let's face it -- skill -- than the written word. Usually. But considering the popularity and effectiveness of visual content in marketing today, you can't just afford to throw in the towel. That's why we decided to take all the pain and suffering out of infographic creation. Seriously -- don't give up just yet. Free Infographic Maker. Free Infographic Maker. The 60 best infographics. Best infographics: Quick links The best infographics can take dry data, complex information or a confusing timeline, and make a clear as crystal graphic which is a joy to look at.
Infographics are almost the perfect encapsulation of what good design, illustration and animation are about: communicating a story or an idea visually, in a way that instantly connects with people, in a way that a lot of raw text can never do. If you're looking to create infographics yourself, then you'll probably want to look at our visualisation tools list. But before you get started, check out our selection of the best infographics on the web today, to get inspiration, ideas and motivation. We've divided these into categories, use the links to your right to jump from section to section. Make Free Infographics, Reports & Charts Online. What Makes the Best Infographics So Convincing.