

Tutorial: Import Data into Excel, and Create a Data Model. Abstract: This is the first tutorial in a series designed to get you acquainted and comfortable using Excel and its built-in data mash-up and analysis features.
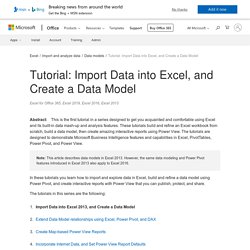
These tutorials build and refine an Excel workbook from scratch, build a data model, then create amazing interactive reports using Power View. The tutorials are designed to demonstrate Microsoft Business Intelligence features and capabilities in Excel, PivotTables, Power Pivot, and Power View. How to Make the Leap from Excel to SQL. Excel as a Database: How to Create a Data Model in Excel 2013. Many blogs, including some originating from our friends in the rainy Pacific Northwest, have referred to the “new” data models in Excel 2013.
I’m not sure “new” is quite the right word. “Useful”, absolutely. “Interesting”, most definitely. How to Create Data Lists in Excel 2016. Liste de 729 couleurs RGB. 50 Things You Can Do With Excel Pivot Tables - Free Microsoft Excel Tutorials. Pivot Tables in Excel are one of the most powerful features within Microsoft Excel.

A Pivot Table allows you to analyze more than 1 million rows of data with just a few mouse clicks, show the results in an easy to read table, “pivot”/change the report layout with the ease of dragging fields around, highlight key information to management and include Charts & Slicers for your monthly presentations. Synoptic Designer for Power BI. 10 reasons to use Excel's table object. Tables began as lists in the menu version of Excel, but they've become more powerful in the Ribbon versions.
Converting a data range into a table extends functionality, which you can then use to work more efficiently and effectively. Here's a look at why you should consider using a table instead of an ordinary data range. To create a table, click anywhere inside the data range and click Table in the Tables group on the Insert tab. This article doesn't include step-by-step instructions for working with lists (the table's predecessor) in Word 2003, although much of the functionality is present in the older list feature.
Also, bear in mind that as handy as tables are, they don't accommodate all of Excel's features. Fit productivity apps to the individual with Microsoft Office 365 Centralized Deployment. Despite all the media buzz surrounding concepts like machine learning and cloud computing, for most enterprise employees, the technology where the real work gets done is in the office productivity suite.
In the Microsoft ecosystem that means Office 365, namely Word, Excel, Outlook, and the other supporting applications from the suite. But for some enterprises, or departments and teams within an enterprise, the standard version of those productivity suite applications require some enhancements in the form of Office add-ins. There are hundreds of add-ins, ranging from document management to templates to Wikipedia definition finders. All of these add-ins are available from the Office Store and many of them are free.
Of course, if you are the administrator charged with maintaining an enterprise-wide deployment of Office 365, a multitude of Office add-ins installed haphazardly across the network is a recipe for annoyance, if not outright chaos. 10 time-saving tips to speed your work in Excel. All of us want to work more efficiently.

Fortunately, there are dozens of ways to save time when working in Excel. In this article, I'll share 10 time-saving Excel tips that share two traits: They work with common tasks you preform all the time and they're 10 of my favorites. I'm using Excel 2016 on a Windows 10 64-bit system, but most of these are valid in older versions. 1: Use Table objects Table objects treat data as a unit and consequently, take care of a lot of things automatically—reducing the amount of time you need to interact with the data.
How to vamp Excel Table objects for better readability and function. Excel 2007 introduced a new object, the Table object.
A Table is a formatted range that has built-in functionality that makes working with data much simpler. You're probably familiar with Table objects by now, but you might not realize how flexible they are; almost anything you can do to a non-Table range, you can do a Table. In this article, I'll show you how to combine two common features that you probably use often with a Table to create a more flexible and functional Table. Specifically, I'll show you how to apply conditional formatting and data validation to a Table. In both cases, the feature enhances the Table. Yulio Blog – news, updates and an intro to VR. Pricing Plans. Microsoft launches Power BI 'publish to web' feature out of preview.
Microsoft today is announcing that it’s making the “publish to web” feature in its Power BI cloud-based business intelligence tool generally available at no additional cost for both free and pro users.

The feature lets users take data visualizations they’ve created inside Power BI and share publicly accessible versions with dedicated URLs and HTML snippets that can be incorporated into other websites. Also today Microsoft is announcing that the Power BI Embedded feature for integrating data visualizations natively into other applications will become generally available on July 11. Microsoft first announced the preview of Power BI “publish to web” in February and announced the public preview for Power BI Embedded at its Build developer conference in March. Embedded BI is something that many BI vendors eventually add in their product offerings, because sometimes the main application for querying and visualizing data just is not enough.
My top 10 tools for a better SharePoint development experience. Hi, The purpose of this blog post is to present some tools that I’m using in my day to day SharePoint activities.
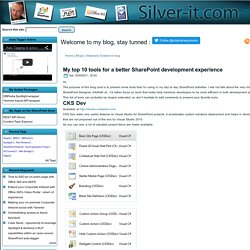
I will not talk about the very rich Microsoft tools such as SharePoint Designer, InfoPath et…I’d rather focus on tools that really help hardcore developers to be more efficient in both development and troubleshooting. This list of tools can probably be largely extended, so don’t hesitate to add comments to present your favorite tools. CKS Dev. Quelques astuces Excel pour impressionner votre chef ou vos clients. Comment faire une relation entre les tables dans Excel 2013. Excel Exercice - Exercice Excel gratuit pour tous. Apprendre Excel : les meilleurs sites. Découvrez GrapeJs, un éditeur de template open source que vous pourrez ajouter à vos projets.
GrapeJS.

Bunkr the presentation tool that displays any online content - Bunkr. Créer un rdv Outlook pour chaque date d'une colonne Excel. Bonjour, Export Outlook Folders to File Folders. Public Const BIF_RETURNONLYFSDIRS = 1 Public Const MAX_PATH = 260 Public Type BrowseInfo hWndOwner As Long pIDLRoot As Long. Fichier de changement pour QGIS 2.12. Feature: Encrypted password management QGIS 2.12 introduces a new authentication system (see PR 2330, QEP 14. Here’s what is included: Master-password-encrypted authentication configurations stored in an SQLite databaseAuthentication method plugin architecture (like data providers)Basic auth method pluginBasic plugin integrated with PostGIS and OWS provider connectionsInline with current username/password setup (still fully functional)SSL server connection configurations (save exceptions or custom configs for SSL connection errors) PKI authentication related: Import extra Certificate Authorities, intermediate cert issuers and personal identity bundlesManage certificate components like in FirefoxAuthentication method plugins for PEM and PKCS#12 bundles on disk, and for stored personal identitiesIntegrated with OWS provider connections (PostGIS and other databases will take a bit more work)
Apprendre à créer un diagramme de Gantt avec Tableur. The following window appears: We need to select the type diagram «bar»: Then, we select "stacked": Web Resources for Microsoft Word from the Frequently Asked Questions (FAQ) Another General Listing of Links to Downloadable Templates APA Template - American Psychological Association Format Google search (thanks to garfield-not-odie for this link) American Psychological Association web site. Using Fields in Microsoft Word - a Tutorial in the Intermediate Users' Guide to Microsoft Word.
After completing this lesson, you will be able to: You will find fields to be one of your basic tools in preparing document templates that will automatically update themselves to reflect information you want to be in the document. Combining them with AutoText will give you a handy toolbox that you can use in all of your documents. This chapter is not a total review of fields, but rather a look at the ones that people working in a legal environment (or similar workplace) have found useful. How to type fields in Word The { } field delimiters can not be typed using the braces characters on the keyboard. Table of Contents - Datazen Documentation. Conversion de données Excel Modeloff 2014. Nous avons vu précédemment dans Une difficile conversion de données avec Excel – Un exemple de Modeloff 2014 (1 de 3) comment normaliser une chaîne de caractères afin de faciliter l’extraction des données. Par la suite, dans Une difficile conversion de données avec Excel – Un exemple de Modeloff 2014 (2 de 3), les données ont été extraites.
D’emblée, je veux rappeler que cet exercice est un exemple réel de la première ronde de tests de Modeloff 2014, un concours international en modélisation financière. Et le concours suggérait de ne consacrer que 35 minutes à cette section, soit 35 minutes pour lire et comprendre la question, pour faire les conversions, les extractions et répondre aux 7 questions (la partie analyse que nous couvrons aujourd’hui). Donc, dans une situation de tests, il faut avoir de très bons réflexes de modélisation, rapidement. Les questions 1 à 3 touchent des consommations moyennes sur des périodes d’une heure.
Mon fichier final est disponible en téléchargement ci-bas. LA CAMÉRA EXCEL: UN OUTIL QUI GAGNE À ÊTRE CONNU! Bernard Andruccioli - Site pédagogique - Tech de Co Bordeaux. Formation Excel VBA JB. Les listes. Il est également possible d'analyser sa liste avec une fonction méconnue, aux explications généralement floues, mais d'une puissance exceptionnelle : « SOMMEPROD ». Bon, tu nous dis du bien de cette fonction, mais on ne sait pas vraiment ce qu'elle a de si particulier juste en voyant son nom... et encore moins sans description ! J'y viens. Elle permet de comptabiliser des données en multipliant des matrices entre elles.
Outils & Graphiques. Sharepoint Archives - Blog des experts CIRCUM. Oui, cela arrive avec Sharepoint 2010, certaines fois vous souhaitez créer un modèle de site , mais la fonctionnalité n’est pas visible (plus visible). La raison est classiquement que la fonctionnalité “serveur de publication Sharepoint” a été activée. En réalité, il se peut que la fonction de création de modèle de site soit tout de même disponible. Pour cela, il vous faudra ruser ! Restez donc dans le site à partir duquel vous souhaitez créer un modèle et saisissez la chaîne de caractère suivante dans l’URL : “savetmpl.aspx” . Vous obtiendrez une URL comme suit : Et voilà, vous y êtes. Attention : lorsque votre site utilise “serveur de publication Sharepoint”, le site produit par l’utilisation du modèle n’aura pas la feature activée… il vous fraudra donc la réactiver, et par la même recréer les pages qui utilisent la feature.
Microsoft Outlook 2013: Use advanced criteria in a custom search folder.