Earth's Life Support Systems - Water and Carbon
> Robgeog
> AS & ALevel Geography - OCR
> Physical Systems
Where nature ends - Humanity’s immense impact on Earth’s climate and carbon cycle. Editor’s note: This is the third in a series of climate briefs.
To read the others, and more of our climate coverage, visit our hub at economist.com/climatechange IT IS ALL, in the end, a matter of chemistry. Carbon dioxide is a form of what chemists call inorganic carbon—a simple molecule that is pretty inert. Fossil fuels are made of carbon in its organic form—often complex molecules that are far from inert. Combustion turns these organic complexities into inorganic simplicities: carbon dioxide, water vapour and heat. Of the energy that people pay for (as opposed to the energy that comes from burning firewood) 34% comes from burning oil, 27% from coal and 24% from gas.
2C: Carbon Cycle Feedbacks. Part C: Carbon Cycle Feedbacks Causal Connections in the Amazon Rainforest.
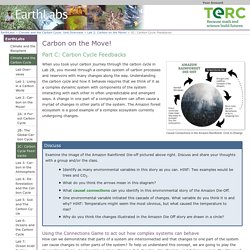
Click to Enlarge. Carbon-Cycle Feedbacks Operating in the Climate System. Cumulative carbon emissions, ΔCem, drive an increase in the combined carbon inventories for the atmosphere, land and ocean [16], {\varDelta} C_{\text{em}} = {\varDelta} C_{\text{atmos}} + {\varDelta} C_{\text{land}}+ {\varDelta} C_{\text{ocean}} ,
Ask the Geographer: Forests and the carbon cycle with Professor Rob MacKenzie and Professor Jerry Pritchard on Apple Podcasts. This new tool uses Google Maps to calculate a city's carbon footprint. Looking at a city’s Google Maps data, in combination with other data, a new tool from Google can estimate the carbon footprint of all of its buildings–and the carbon footprint of all the car trips, bus and subway rides, and other transportation used by the people living there.
The Environmental Insights Explorer, an online tool that launched in beta on September 10 and is still in development, is designed to help cities deal with the first step of a plan to reduce emissions: knowing what their current carbon footprint is. More than 9,000 cities have already committed to cut emissions in line with the goals of the Paris Agreement, but more than a third of those cities haven’t yet built an inventory of emissions.
The process can take months or even years, and cost hundreds of thousands of dollars, making it particularly challenging for smaller cities.
Record rains made Australia a giant green global carbon sink. Record-breaking rains triggered so much new growth across Australia that the continent turned into a giant green carbon sink to rival tropical rainforests including the Amazon, our new research shows.
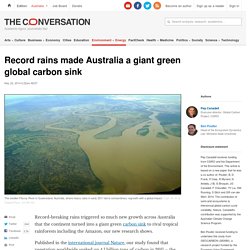
Published in the international journal Nature, our study found that vegetation worldwide soaked up 4.1 billion tons of carbon in 2011 – the equivalent of more than 40% of emissions from burning fossil fuels that year. Unexpectedly, the largest carbon uptake occurred in the semi-arid landscapes of Australia, Southern Africa and South America. It set a new record for a land-based carbon sink since high-resolution records began in 1958, in a remarkable example of ecosystems working to stabilise the Earth’s climate.
And that had a global impact.
Carbon catch-22: the pollution in our soil. Bad behaviour doesn’t usually have good consequences but our fossil fuel and fertiliser habits may have had some “good” environmental side-effects.
Our new research suggests that the last 200 years of pollution have increased the carbon stored in soils across natural ecosystems in Britain. And this locking in of carbon in soils provides an offset for some of our carbon emissions. But the catch-22 is if we kick our polluting habits, this carbon is at risk of returning to our atmosphere, contributing to climate change.
Deep Earth carbon cycles cracked. Will the Arctic shift from a carbon sink to a carbon source?
Studies show that the warming of the climate system is altering the movement and storage of carbon in the far north of the Earth.
And these changes carry global implications. Among the many questions that scientists such as myself are investigating is whether the Arctic will continue being a net absorber of carbon, or shift to become a net emitter. The Earth’s carbon cycle – the movement and storage of carbon between the land, atmosphere and oceans – is a fundamental element of the climate system. Oceans are currently the Earth’s greatest carbon sink, meaning they absorb more carbon than they emit.
Amazon carbon sink is in decline as trees die off faster. Tropical forests are being exposed to unprecedented environmental change, with huge knock-on effects.
In the past decade, the carbon absorbed annually by the Amazon rain forest has declined by almost a third. At 6m km2, the Amazon forest covers an area 25 times that of the UK, and spans large parts of nine countries.
Explainer: what is carbon capture and utilisation?
Carbon and carbon dioxide are found all around us.
All living things contain carbon - it’s one of the essential building blocks of life and is fundamental to many chemical processes. Carbon dioxide (CO2) is produced by respiration and combustion and is used by plants in photosynthesis. However we produce more CO2 than can be absorbed naturally as part of the carbon cycle, hence why atmospheric CO2 levels have risen to the highest point measured for 800,000 years. Most everyday items contain carbon, usually as plastics - computers, medicines, cars, clothes, buildings. Most of this carbon originates from petroleum or coal, fossil fuels buried underground for millions of years.
The predominant view is that CO2 is a waste product, and a polluting one at that, even though small amounts are used to carbonate fizzy drinks, or to make urea or useful industrial solvents. CO2 can be captured from industrial sources such as power plants, steel or cement works, or collected from the air.
A Level Geography Water and Carbon cycles key words. Flashcards. Coolgeography - Water and Carbon Cycles. Systems in Water and Carbon Cycles 3.1.1.2 The water cycle Global distribution & size major stores of water Processes driving change in the magnitude of water stores over time and space.
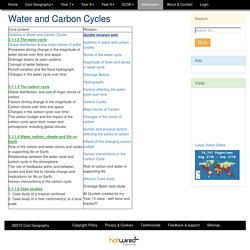
Drainage basins as open systems Concept of water balance. Runoff variation and the flood hydrograph. Changes in the water cycle over time 3.1.1.3 The carbon cycle Global distribution, and size of major stores of carbon Factors driving change in the magnitude of Carbon stores over time and space Changes in the carbon cycle over time The carbon budget and the impact of the carbon cycle upon land, ocean and atmosphere, including global climate.
Water use and the water cycle - OpenLearn - Open University - S278_12.
SCO WaterandCarbonCycling. Water and Carbon Cycles Revision Study Notes for A. The Amazon effect: how deforestation is starving São Paulo of water. São Paulo could face more devastating water shortages if farmers continue to clear the Amazon forest, warns the utility chief who recently steered the biggest city in the Americas from the edge of drought catastrophe.
Jerson Kelman, president of water company Sabesp, told Guardian Cities he felt a duty to speak out because he was a citizen as well as the head of a company who had seen firsthand how close this metropolis of 21 million people had come to a breakdown. “We should not transform the Amazon into pastureland,” he said in an interview. “The Amazon creates a movement of water. If you could follow a molecule of water you would see that most of the clouds that are over São Paulo have passed across the Amazon. If the forest is cut, we’ll be in trouble.” The mayor of São Paulo, João Doria, appears to have been persuaded. The 2014-15 drought was no ordinary dry period.
Expansion of agricultural land reduces CO2 absorption. Plants absorb some of the carbon dioxide (CO2) released into the atmosphere by burning fossil fuels. But increasing deforestation and other changes in land use will reduce the CO2 absorption capacity of these areas in the future.
This is what a study by climate researchers from Karlsruhe Institute of Technology (KIT) suggests. Their results are now published in Environmental Research Letters. Climate change is heavily related to the increase of CO2 in the atmosphere. During photosynthesis, plants absorb some of the industrial CO2 emissions from the atmosphere, making them contribute significantly to climate protection. A research group led by Arneth and Dr.
Congo basin’s peaty swamps are new front in climate change battle. Stumbling on submerged roots, attacked by bees and wading waist-deep through leech-infested water, the three researchers and their Pygmy guides progress at just 100 metres an hour through the largest and least-explored tropical bog in the world.
The group halt and unpack what looks like a spear, which is plunged over and over again into the waterlogged forest floor. Each time it brings up a metre-long core of rich, black peat made up of partly decomposed leaves and ancient plantlife. The deepest the steel blade reaches before meeting the underlying clay is 3.7 metres. Leeds University forest ecologists Simon Lewis and Greta Dargie cheer.
Lewis and Dargie surprised the world earlier this year when they showed that the peatlands on either side of the Congo river contained one third of all the world’s tropical peat and were five times more extensive than anyone had thought, stretching over 145,500 sq km (56,000 sq miles), an area larger than England. “We did not know the peat was there.
Forest Carbon 101. Where Do Trees Come From?
MrC’s Tree carbon content calculator.
Where do trees get their mass from? As trees photosynthesise they use sunlight to combine carbon dioxide (CO2) from the atmosphere with water and nutrients from the ground to form carbohydrates which make up the tree’s biomass. CO2 is taken in at a certain rate and builds the mass of the tree over time. Biomass is a measure of the dry mass of woody and leaf matter in kg. The carbon content of a tree is approximately 50% of its biomass (dry mass), though recent studies show this varies a lot between species and locations e.g tropical and boreal.
21st Century Challenges. What’s the challenge? Society needs to decide whether geoengineering, failing attempts to curb emissions, should be researched as plan b.
Are the dangers associated with geoengineering too great?
Key Stage Five. This section contains a selection of teaching resources that were produced by the Met Office education team for Key Stage Five (ages 16 - 18). This resource was commended by the Scottish Association of Geography Teachers, 2016.
The carbon and water cyles, climate and change. Anglian river basin district river basin management plan. BasinOverview. Wetlands Restoration Definitions and Distinctions. What Is Wetland Restoration? In its 1992 report, Restoration of Aquatic Ecosystems, the National Research Council defined restoration as the "return of an ecosystem to a close approximation of its condition prior to disturbance.
" The concept of restoration is further clarified by defining many types of restoration-related activities. These activities, such as creation, reallocation and enhancement, are similar to restoration, but differ in some way from the process of renewing native ecosystems to sites where they once existed.
National Geographic : National Geographic. Join Leonardo DiCaprio as he explores the topic of climate change, and discovers what must be done today to prevent catastrophic disruption of life on our planet. ➡ Subscribe: ➡ Get the soundtrack on iTunes: ➡ Discover your climate impact: ➡ Learn more & take action: Watch an exclusive sneak peek of MARS: Act Now #BeforeTheFlood: For every use of #BeforeTheFlood across Facebook, Twitter, and Instagram between October 24 – November 18, 21st Century Fox and National Geographic will together donate $1 to Pristine Seas and $1 to the Wildlife Conservation Society, up to $50,000 to each organization.
About Before the Flood: Before the Flood, directed by Fisher Stevens, captures a three-year personal journey alongside Academy Award-winning actor and U.N.
Water in the Anthropocene. Why Forests? Why Now? A Preview of the Science, Economics, and Politics of Tropical Forests and Climate Change. Why Forests? Why Now? (CGD, forthcoming) draws upon science, economics, and politics to show that tropical forests are essential for climate stability and sustainable development, that now is the time for action, and that payment-for-performance finance is a course of action with great potential for success.
Maps & Data. Systems and Feedbacks. The Basics of Climate Feedback Loops. The Amazon Region Protected Areas program is the single largest tropical forest conservation program in history.
The Carbon Cycle 3D Animation. When Permafrost Melts, What Happens to All That Stored Carbon?
A new study documents evidence of a massive release of carbon from permafrost as temperatures rose at the end of the last glacial period. Photo: Dentren/CC-BY-3.0. Geogarific: Water and Carbon in the Amazon Rainforest. For the past 6 years teaching geography A-level I've had to choose between ecosystems and plate tectonics so sadly I haven't taught much on tropical rainforests for quite a while (you can guess which of the two aforementioned topics is more popular!).
Giant icebergs play 'major role' in ocean carbon cycle. BBC Taster - Bitesize Masterclass No.2. Rise in atmospheric CO2 slowed by green vegetation. Image copyright SPL. Alaska's Last Oil. Climate urgency: we've locked in more global warming than people realize.
While most people accept the reality of human-caused global warming, we tend not to view it as an urgent issue or high priority. That lack of immediate concern may in part stem from a lack of understanding that today’s pollution will heat the planet for centuries to come, as explained in this Denial101x lecture: So far humans have caused about 1°C warming of global surface temperatures, but if we were to freeze the level of atmospheric carbon dioxide at today’s levels, the planet would continue warming.
The carbon and water cyles, climate and change.
SCO WaterandCarbonCycling.


