

Investigamos en primaria. How to collect and use student data in art class. Data matters in the classroom.
This is why schools and teachers put so much emphasis on collecting it. But that emphasis tends to focus on the “core” academic subjects in school as opposed to the creative subjects. This is an unfortunate side effect of the increasing significance placed on standardized test scores in math, science, and language arts as the main indicators of student growth.
Schools that focus solely on these subjects ignore a big piece of the education puzzle: art classes. Why art class data matters. Data Collection Methods. Interviews If you asked someone completely unaware of data analysis how to best collect information from people, the most common answer would likely be interviews.
Almost anyone can come up with a list of questions, but the key to efficient interviews is knowing what to ask. Infographics & Data Visualization. Using graphics and text to present data and information in not a new idea.
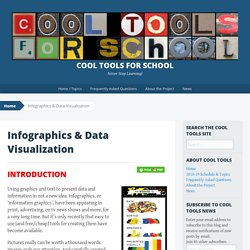
Infographics, or ‘information graphics’, have been appearing in print, advertising, on tv news shows and more, for a very long time. But it’s only recently that easy to use (and free/cheap) tools for creating them have become available. Pictures really can be worth a thousand words. Images grab our attention. Visualizing Finance Lab. Domestic Data Streamers - Independent Data Design Studio. PAU GARCIA - Big data arte. The beauty of data visualization - David McCandless. Learning analytics - Lidia Castañeda. Big Data Art – Piloting the Lesson. We are excited to announce a new addition to our curriculum!
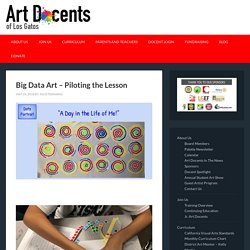
This year we have been developing a lesson that we will teach in the Fall called “Big Data Art” in the 6th grade math classes. We realized that not only did we need to fill a hole in our curriculum for 6th grade, but we also wanted to create a lesson that was on the cutting edge of Art and how it relates to the STEAM initiative. Just this May, our Curriculum team, after many months of developing the lesson, actually tested it out with five 6th grade classes.
Telling stories with numbers: five artists using big data. We generate 2.5 quintillion – or 2.5 million trillion – bytes of data that record our online activity each day: an inconceivable amount.
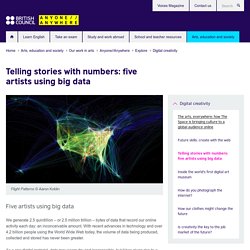
With recent advances in technology and over 4.2 billion people using the World Wide Web today, the volume of data being produced, collected and stored has never been greater. As a raw digital material, data may seem dry and inaccessible, but it has given rise to a new type of artist. Data artists specialise in making the unseen visible through artworks, using innovative data visualisation techniques to show the viewer something that the numbers alone cannot. Many source their raw data from the web, while others take offline data and use the web to turn it into something accessible, and often beautiful.
Datos con rostro: el nuevo arte en la Revista Retina. El arte cumple la misión de ayudarnos a comprender lo que es demasiado abstracto, confuso o absurdo como para poder procesarlo solo a base de razón.
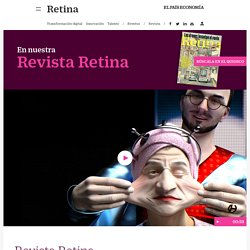
En el contexto de la sociedad digitalizada, dejar de intentar entender lo que no tiene sentido o ver más allá del sentido aparente supone, por ejemplo, reflexionar sobre los excesos de un mundo intoxicado de imágenes o visualizar conceptos tan abstractos como el big data. El artista Daniel Canogar explica sobre este último en nuestro reportaje de portada: “Lo sentimos, sabemos que está detrás de nuestros teléfonos… pero no lo vemos.
Como artista me interesa hacerlo más visible”. En dirección contraria, lo digital ayuda a crear procesos y experiencias con más medios que nunca en la historia. ¿Podrán los robots crear? Puede un robot tener inspiración?
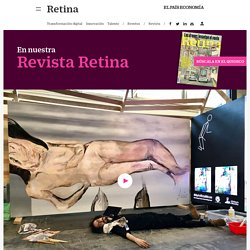
Dos científicos y a la vez artistas se han propuesto comprobar si es posible. Para ello, han desarrollado una inteligencia artificial capaz de generar formas y hasta composiciones completas originales. Mostraron el resultado de su trabajo en junio de 2017 en el Sónar de Barcelona con el proyecto My Artificial Muse. Arte impulsado por la tecnología para entender el nuevo mundo. El Sanford Museum de Cherokee, una población de Iowa (EE UU) de poco más de 5.000 habitantes, no es ni mucho menos uno de los grandes centros del arte mundial.
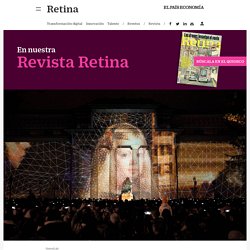
Sin embargo, ostenta el honor de haber exhibido por primera vez una obra generada con un ordenador. El matemático y artista local Ben F. Art Docents. Open Learning Analytics. Una aproximación al arte basado en datos - hybridart. Menú Arte, ciencia y tecnología Cursos y talleres Curso online de Isadora para la creación artística – SEGUNDA EDICIÓN Arte y tecnología Una aproximación al arte basado en datos.
Diferencias entre STEM y STEAM. A simple vista la diferencia entre STEM y STEAM es una letra, la “A” que significa Arte, sin embargo, en el fondo representa un importante cambio.
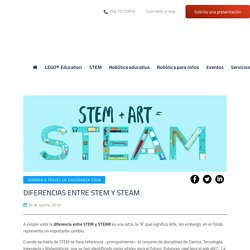
Cuando se habla de STEM se hace referencia –principalmente– al conjunto de disciplinas de Ciencia, Tecnología, Ingeniería y Matemáticas, que se han identificado como vitales para el futuro. Entonces ¿qué hace el arte ahí?... La respuesta es contundente: innovar. Diferencias entre STEM y STEAM. Learning Analytics: el poder del big data en la educación. Vivimos en un mar de datos que gracias a la tecnología big data pueden ser recopilados, procesados y analizados. Esta práctica ha llegado a la educación a través de la analítica del aprendizaje, un conjunto de técnicas para llegar a conocer a los alumnos y los entornos de aprendizaje a través de las trazas digitales que dejan. “Este es un mundo en el que cantidades masivas de datos y la matemática aplicada reemplazan a cualquier otra herramienta que pueda ser propuesta.
Fuera con todas las teorías sobre el comportamiento humano, de la lingüística a la sociología. Olvidad las taxonomías, la ontología y la psicología. ¿Quién sabe por qué la gente hace lo que hace?