

DAVID GARCIA (ECO-EXCEL) Art of Memorizing. Happy Saturday everyone here is a throwback for ya! Make yourself stand out in… 50+ Best Free Excel Templates & Dashboards for Any Occasion. Excel templates are great because they can be applied to different business scenarios and be reused time and time again. Sometimes one of your business templates may need some minor tweaks to better suit your purposes but having a good template on hand will save you a lot of time and effort. What’s better than a reusable Excel template? Perhaps, a dashboard template . On the high end of templates are dashboards, which take your data and push them into cool looking charts and gauges that help measure progress. Whats better than that? Templates take the labor out of working in Excel. Personal Finance Wonder where all the money goes at the end of the month?
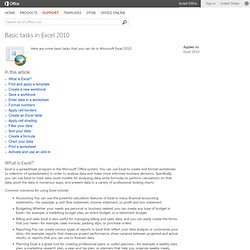
Portfolio Slicer takes fetches data from Yahoo! Having trouble remembering your deductible donations at tax time? General Business Manage any project with this Project Budget template, which allows you compare actual project expenditures to estimates and helps you evaluate whether your project is staying within budget. Basic tasks in Excel 2010. In this article.
Can’t remember all those Excel keyboard shortcuts? Now you don’t have to! Today’s blog post on keyboard shortcut reference cards is brought to you by Office.com writer, Turi Henderson.
Turi has been on the Office.com team for a few years, writing mainly about Accessibility features and Language Tools, and periodically plying her coworkers with fine baked goods. Keyboard shortcuts… You use them every day to make your work flow smoothly, or – in some cases – to make your work flow, period. In all honesty, I use some of them so often that I have no idea where to find those functions on the ribbon! (Copy? Cleaning and Preparing Your Data Using Excel. Conditional formatting tricks: Sum values in Excel by cell color.
When you think VBA code is your only hope, try combing built-it conditional formatting tools.
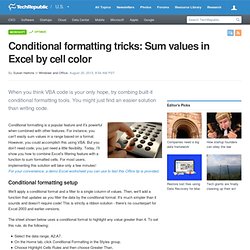
You might just find an easier solution than writing code. Conditional formatting is a popular feature and it's powerful when combined with other features. For instance, you can't easily sum values in a range based on a format. However, you could accomplish this using VBA. Create a dynamic Excel chart and make your own dashboard. A dynamic chart reuses the same chart object to chart different source values.
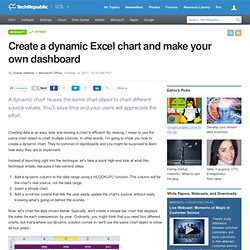
You'll save time and your users will appreciate the effort. Charting data is an easy task and reusing a chart is efficient! By reusing, I mean to use the same chart object to chart multiple sources. In other words, I'm going to show you how to create a dynamic chart. They're common in dashboards and you might be surprised to learn how easy they are to implement.
Instead of launching right into the technique, let's take a quick high-end look at what this technique entails, because it has several steps: Excel. Excel Formulas. Formulas NOTE: This page is no longer updated.
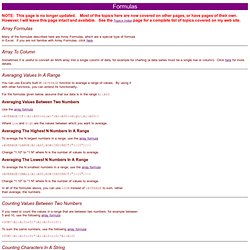
Most of the topics here are now covered on other pages, or have pages of their own. However, I will leave this page intact and available. See the Topics Index page for a complete list of topics covered on my web site. Array Formulas Many of the formulas described here are Array Formulas, which are a special type of formula in Excel. Excel Formulas.
Excel Hints & Tips. Excel Reporting Dashboard - Transform Your Data. Every day, millions of business professionals use Excel for number crunching and data analysis.

When it comes to these types of tasks, no one can argue—Excel is fantastic. So what can Domo add to such a powerful solution? With Domo, you can pull Excel spreadsheets—along with any other source of data you care about—into a single, intuitive platform for business users. Excel Reporting Like You've Never Seen it Before. Excel Tips and Tricks. Excel Tips, Tricks & Info. Excel to XML - Easy Excel Tutorial. You can convert your Excel file to an XML data file, or vice versa.
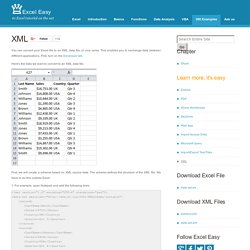
This enables you to exchange data between different applications. First, turn on the Developer tab. Here's the data we want to convert to an XML data file. First, we will create a schema based on XML source data. The schema defines the structure of the XML file. 1. <? Note: the tags refer to the column names, but you can give them any name you want! Excel Training & Tutorials. Free Excel Training! Go Beyond Excel to Analyze Your Data. Skip to main content Free Whitepaper Go Beyond Excel to Analyze Your Data Get the Whitepaper Go Beyond Excel to Analyze Data 5 Strategies for Improving Your Analytics There’s no doubt that Excel has been one of the tools of choice for analysis and reporting.

Out-of-date data (and no easy way to update), error-prone analytics, multiple versions of the same file circulating among colleagues, too much manual involvement—these are just a few of the frustrations commonly associated with Excel. How to find duplicates in Excel. You'll need more than one trick up your sleeve to find duplicates in Excel.
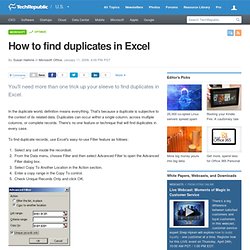
In the duplicate world, definition means everything. That's because a duplicate is subjective to the context of its related data. Duplicates can occur within a single column, across multiple columns, or complete records. There's no one feature or technique that will find duplicates in every case. Make every user a power Excel user with dynamic conditional row banding. Combine data validation and conditional formatting to implement an easy-to-use dynamic banding option for your users.
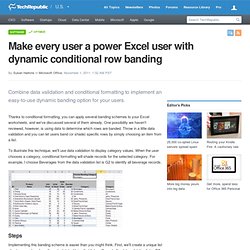
Thanks to conditional formatting, you can apply several banding schemes to your Excel worksheets, and we've discussed several of them already. One possibility we haven't reviewed, however, is using data to determine which rows are banded. Throw in a little data validation and you can let users band (or shade) specific rows by simply choosing an item from a list. An Excel blog for engineers and scientists, and an engineering and science blog for Excel users. Qué hacer en Excel o en Power Pivot. The Excel Magician: 70+ Excel Tips and Shortcuts to help you make Excel Magic.
Posted by nitzan on Wednesday, November 28th, 2007. The Ultimate Excel Cheatsheet. Working with the new Excel 2007 is now more frustrating than ever when it comes to finding the right commands. Sometimes it seems like part magic and part luck. That’s why we’ve put together the cream of the crop of Excel shortcuts in easy to use cheatsheets you can print up and keep handy. Highlighting the most commonly used and commonly looked for Excel commands, this list puts it all at your fingertips. The Ultimate Excel Cheatsheet. Two ways to build dynamic charts in Excel. If you want to advance beyond your ordinary spreadsheet skills, creating dynamic charts is a good place to begin that journey. The key is to define the chart's source data as a dynamic range. By doing so, the chart will automatically reflect changes and additions to the source data.
Fortunately, the process is easy to implement in Excel 2007 and 2010 if you're willing to use the table feature. If not, there's a more complex method. We'll explore both. The table method First, we'll use the table feature, available in Excel 2007 and 2010-you'll be amazed at how simple it is.
Click the Insert tab.In the Tables group, click Table.Excel will display the selected range, which you can change. Two ways to build dynamic charts in Excel.