
Untitled. A quarter of UK homes sit in areas with dangerously high levels of air pollution, an new nationwide study has found.

The study - commissioned by The Central Office of Public Interest (COPI) - discovered that the air outside the doors of almost eight million homes in the UK exceeds one or more of the World Health Organisation's (WHO) recommended limits for nitrogen dioxide (NO2) or particulate matter. Researchers at Imperial College London who conducted the study divided the UK into 20m-by-20m squares and fed emissions data into computer models to produce the most detailed analysis of pollution levels in the UK to date. COPI has said that estate agents may be breaking the law when failing to inform buyers that air outside their home exceeds WHO recommendations. As a result, a new air pollution rating system has been launched to offer an air quality report for every UK address.
To find out how polluted the air outside your home is, you can access the tool at this link. Find your postcode and get information on your local area. Placemaking - FSC Geography Fieldwork. 2.
Method All Geography starts with someone going into the field to find out what's there. This section will help you to gather the primary data (data you collect yourself) and secondary data (data collected by someone else) that will support your analysis and conclusions. Characteristics of urban places 1. This is a useful way to explore places. Try taking a large scale street map of a city and trace out a circle on it. Exploring Birmingham city centre by tracing circles. On your journey though the place, make a record of what you see, hear and smell. 2. Placechecks is another way to start exploring a place. Imagine that you are a local resident. What do you like? The Placechecks walkabout has a list of 21 questions to ask to help explore what makes places special. British Geological Survey (BGS)
ScotLIS - Scotland's Land Information Service. CPOP. Acorn - The smarter consumer classification. Diversity Index - IB Geography. A community dominated by one or two categories is considered to be less diverse than one in which several different categories have a similar abundance. Simpson's Diversity Index is a measure of diversity which takes into account the number of categories present, as well as the relative abundance in each category. Inequalities - FSC Geography Fieldwork. 2.
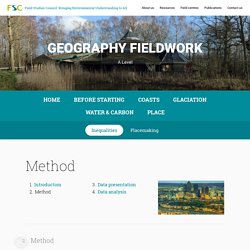
Method All Geography starts with someone going into the field to find out what's there. This section will help you to gather the primary data (data you collect yourself) and secondary data (data collected by someone else) that will support your analysis and conclusions. Diversity Index - IB Geography. Scotland's environment web. Www.Saa.gov.uk - Scottish Assessors Association Saa.gov.uk Saa is ranked 66,904 in the United Kingdom. 'Scottish Assessors Association .' 66,904Rank in United Kingdom 985,277Worldwide Rank Last Updated: 06/04/2018 .
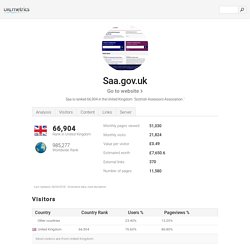
Visitors Most visitors are from United Kingdom. Content Topics: The Saa, The Assessor, Non Domestic Valuation, Council Tax, Electoral Registration, and East Ayrshire. Scotland's Soils - soil maps. National soil map of Scotland This shows the distribution of the main soil types across the whole of Scotland.
It was originally mapped at the 1: 250 000 scale. © Copyright James Hutton Institute. Soil map of Scotland (partial cover) This covers most of Scotland’s cultivated agricultural soils and adjacent uplands. World Reference Base soil map World Reference Base soil map uses an international soil classification based on soil characteristics, properties and horizons (layers). National scale land capability for forestry The national scale land capability for forestry map provides information on how well a piece of land could grow trees based on a number of factors including soil, climate and topography. Geography Resources for Teachers. SQA - Understanding Standards: Project-folio. (2) Statistics booklet 2. Barry and Ben The Geography Men - How To Measure a River. London Geography Alliance - Soils. Nomis - Official Labour Market Statistics. London household spending outstrips the rest of the UK. London households’ average weekly spending is one and-a-half times more than households in the North East of England, latest data from the ONS shows.
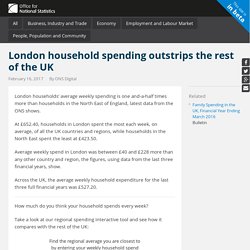
At £652.40, households in London spent the most each week, on average, of all the UK countries and regions, while households in the North East spent the least at £423.50. Average weekly spend in London was between £40 and £228 more than any other country and region, the figures, using data from the last three financial years, show. Across the UK, the average weekly household expenditure for the last three full financial years was £527.20. How much do you think your household spends every week? Take a look at our regional spending interactive tool and see how it compares with the rest of the UK: Source: Family Spending in the UK, Financial Year Ending March 2016. Aigas - Environmental Education. Our charitable environmental education project, known as 'Naturedays at Aigas', provides environmental education for thousands of children a year.

SIMD Postcode Lookup. Scottish Government SIMD Postcode Lookup Subscribe for updates Register to receive email news alerts, daily digest, weekly roundup or Topic newsletters.

Menu. DataShine: Scotland. Talking about statistics: Introduction to Census data and practical applications - Inverurie 17th February. The following CPD event was organised by the Aberdeenshire Council and held at Inverurie Academy on 17th February 2015.
The session was jointly presented by Celia Macintyre (National Records of Scotland) and Tom Macintyre (University of Edinburgh). CPD Programme 2014–2015 Introduction to Census data and practical applications Outline This course outlines the results from the 2011 Census in Scotland, and demonstrates a number of ways of accessing and using the published resources. Objectives At the end of the course participants will be able to: • Explore the Census 2011 results for Scotland • Download data extracts into a suitable format for analysis • Generate appropriate summary statistics and create charts and graphs to illustrate findings Worksheets.