

Visual content: 5 things you should know. Did you know that 90 percent of information transmitted to the brain is visual, and our brains process visuals 60,000 times faster than text?
* That, along with how easy it now is to access (more) data and share content via social tools, explains the popularity of infographics we’ve seen in recent years. But going from text to visual content is a big shift for many of us; consider these five things before you start. Visuals turn on parts of the brain that words cannot, which is why infographics are infiltrating external content strategies for deeper audience engagement.
And judging by the level of interest in this topic we’re hearing, internal communicators are also eager to move away from words and towards visuals, to turn complex (and sometimes dull) business information into something meaningful. The power of imagery in communications. Riding the wave of bigger, better and more pictures online we spoke to three experts, Justin Sutcliffe, Jeremy Waite and Suzanne Salvo to found out why and how internal communication can benefit.

“Pictures can tell a 1000 words.” We all know it and yet it is only recently that there has been a significant shift towards greater prominence of imagery online. Most significantly across social networking sites. Google+, in its attempts to rival Facebook, has heavily invested in the imaging side of its social network, making it their USP. It has lightbox integration and basic editing functions built in. In July, Facebook responded to Google’s changes and announced updates that further boost the prominence given to images. Enter Pinterest and Instagram, the former is revolutionising the way we share content across the web and the latter is a photo-sharing network that Facebook is acquiring for a hefty sum, currently standing at $747 million. What is it about images?
Grinding mediocrity. Infographics Inside the Organization. In many ways, using infographics to communicate with internal stakeholders serves the same purpose as using them in a content marketing capacity with external audiences.
They get people’s attention, help simplify complex ideas, and embed understanding. Infographics are becoming a mainstream marketing communication tool, thanks in part to the exposure they have gained across social media channels. But has this digital exposure increased adoption of information design as a tool for internal communication, education, and decision-making? Although not as popular as content marketing infographics targeted at external audiences, data visuals and information designs created to communicate with employees are slowly being adopted by organizations.
Joe Pulizzi from the Content Marketing Institute agrees that infographics are being used primarily for external communication, but he sees some internal crossover starting to take place. Decision-Making Training Exchanging Ideas. Daily Infographic. Is Your State’s Highest Paid Employee A Football Coach?
(Probably) [Infographic] 03/24/2014 • Coming from Texas, I grew up knowing that football was important to a lot of people. Being a musician and member of the school marching band, half of the 10 Shocking Statistics About Employee Engagement [infographic] 02/02/2014 • Having a role is good. Employee Happiness as a Business Tool [infographic] 06/20/2013 • Times are tough for us post graduates. Happiest Airline Employees [infographic] 11/09/2012 • Flying has always been one of my favorite ways to travel.
MorgueFile free photos for creatives by creatives. Infographic Turns Boring Corporate Workflow Into Buzzing Metropolis. Have you ever taken a low-level job with a major corporation?
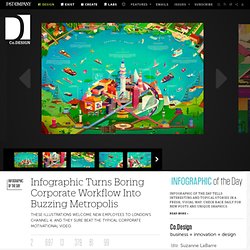
Maybe you were a sales associate or a burger flipper? If so, you likely sat through at least a day of employee orientation, filled with management lectures, videos from corporate and, worst of all, those posters filled with acronyms. W.A.S.T.E.O.F.T.I.M.E. If you have any interest in inspiring the corporate troops, take a lesson from these amazing illustrations by Jack Hudson and INT Works for London’s Channel 4. They explain how the media property functions, not by using unwieldy charts or boring orientation materials, but by providing a total visual extravaganza.
Take the first graphic, that draws Channel 4’s online team like a city filled with transportation vehicles. “I think my aim was to create an entire world in which the audience could get lost inside,” Hudson writes Co.Design. Award Winning Internal Communications Agency. Complicated and content-heavy communication is a sure way to disengage your employees and ensure meaning is lost.
Could visual thinking approaches and weaving imagery into your messages be the way forward for maximum understanding and engagement? In prehistoric times, when mankind took its first steps with communication, cavemen drew on walls to share stories. Fast forward thousands of years and children make sense of the world around them instinctively by drawing pictures and learning from picture books. The human brain is best designed to retain information when it is demonstrated pictorially through clear and bold imagery. Research suggests that 30 percent of people learn best through the use of visual/spatial thinking, 45 percent use a combination of visual/spatial thinking and thinking in the form of words, and 25 percent think exclusively in words.