
7 best tips for creating infographics. 13 incredible tools for creating infographics. Infographic makers will enable you to transform mountains of data into easy-to-read visuals. Information is much more accessible when presented in a well-designed infographic rather than dense reams of data, so people are likely to be much more engaged with the subject. However, it can be time-consuming to put them together. 15 Free Infographic Templates.
Easil - Great marketing starts here. Improving Creativity: 9 Ways to Make it Happen [Infographic] Improving creativity is a lifetime pursuit and one that will serve learners well beyond school.
![Improving Creativity: 9 Ways to Make it Happen [Infographic]](http://cdn.pearltrees.com/s/pic/th/creativity-infographic-151653812)
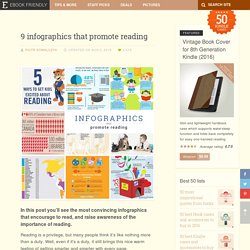
We are living in an age in which artistic appeal is now fundamental to any product’s success on the market. Exceptional art and design inspire and entice us like nothing else can. That’s where Creativity Fluency comes in. What happens to your body after you start reading a book infographic. 9 infographics that promote reading. In this post you’ll see the most convincing infographics that encourage to read, and raise awareness of the importance of reading.

Reading is a privilege, but many people think it’s like nothing more than a duty. Well, even if it’s a duty, it still brings this nice warm feeling of getting smarter and smarter with every page. In times of the internet, with its distractions and information overload, it’s harder and harder to find time and attitude to do such an easy thing as opening a book. Label 59 : Label . Explain . Present interactively ... in minutes.
Clarisketch. 5 Tips to Spark Lively Online Discussions Infographic - e-Learning Infographics. Distance Education Infographics e-Learning Infographics Social Learning Infographics 5 Tips to Spark Lively Online Discussions Infographic 5 Tips to Spark Lively Online Discussions Infographic Via: www.percolatelms.com Embed This Education Infographic on your Site or Blog!

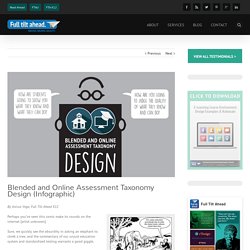
Copy and Paste the following code! Blended and Online Assessment Taxonomy Design. By Anissa Vega, Full Tilt Ahead K12 Perhaps you’ve seen this comic make its rounds on the internet [artist unknown].

Sure, we quickly see the obsurdity in asking an elephant to climb a tree, and the commentary of our unjust education system and standardized testing warrants a good giggle. Collaborative Visual Intelligence. Dipity - Find, Create, and Embed Interactive Timelines. Emaze - Online Presentation Software – Create Amazing Presentations. Infographics on Pinterest. Infographics as a Creative Assessment. Create Easy Infographics, Reports, Presentations. PixTeller - Image Maker. Sketchnotes & Sketchnoting - Dein kreatives Werkzeug! Design flyers to spread the word online. Make Beautiful Infographics.
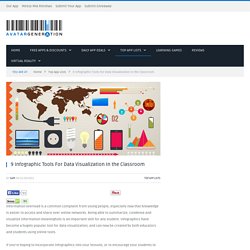
Original Content Marketing for Brands. Vizualize.me: Visualize your resume in one click. 9 Infographic Tools For Data Visualization in the Classroom. Information overload is a common complaint from young people, especially now that knowledge is easier to access and share over online networks.

Being able to summarize, condense and visualize information meaningfully is an important skill for any student. Infographics have become a hugely popular tool for data visualization, and can now be created by both educators and students using online tools. If you’re hoping to incorporate infographics into your lessons, or to encourage your students to learn to communicate information visually, we’ve come to the rescue! These ten web-based and iOS apps will help you integrate infographics into a host of different lessons. Piktochart. What do we think about ebooks.