

5 Painless Ways To Make Office Communication Less Frustrating. What's on your desk right now?

A smartphone? Laptop? Tablet? Landline? Technology is supposed to make your life easier, but what happens when the majority of your day is spent doing work about work? You know what we’re talking about--meetings that never end, e-mail strings that span days. 1. Instead of spending time flipping between e-mails and to-do lists, keep all the information your team needs in one place. “I’ve found that you can’t hold an employee accountable if they’ve received 1,001 emails for the same project. Many collaboration tools offer free service for smaller teams or free trials so you can test-drive the solution to find the one that works best for your team. 2. The Emerging Role of the Chief Digital Officer. Cognos Financial Performance Receivables Analytics. Analytic reporting for minimizing delinquent accounts and improving cash flow IBM® Cognos® Financial Performance Receivables Analytics provides packaged reporting and analysis of accounts receivable.
It is a module of the Cognos Financial Performance Analytics application. The solution helps finance managers quickly assess account history, customer payment trends, departmental effectiveness, high-risk accounts, cash inflow trends and measures of customer satisfaction. Cognos Financial Performance Receivables Analytics helps finance minimize delinquent accounts and bad debts, and improve cash flow. Assess customer payment trends—analyze payment histories and identify high-risk accounts. More Less Assess customer payment trends Track customer payment patterns and analyze the risk of nonpayment.Segment customers based on size, strategic value and risk.Detect patterns of ongoing payment adjustments to correct billing errors, reduce process costs and improve customer satisfaction. View demo. 10 Social Media Facts You Should Know in 2014. Did you know 500 million tweets are sent every day?
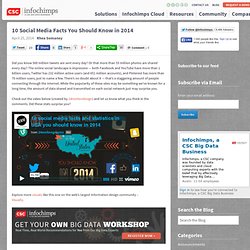
Or that more than 55 million photos are shared every day? The online social landscape is impressive — both Facebook and YouTube have more than 1 billion users, Twitter has 232 million active users (and 651 million accounts), and Pinterest has more than 70 million users, just to name a few. There’s no doubt about it — that’s a staggering amount of people connecting through the Internet. While the popularity of these sites may be something we’ve known for a long time, the amount of data shared and transmitted on each social network just may surprise you.
Data Visualization Data Visualization. The following is a joint guest post by Umbel's web engineer Ben Papillon and front-end web developer Amelia Watternberger on their thoughts after the 2014 OpenVis Conference in Boston.
The investor Paul Graham has a well-known article called "Cities and Ambition," in which he describes Cambridge, MA, the site of the 2014 OpenVis Conference, as the "intellectual capital of the world," a city which, more than any other, values the genesis and exchange of new ideas: "What I like about Boston (or rather Cambridge) is that the message there is: you should be smarter. You really should get around to reading all those books you've been meaning to. " This type of data visualization is a young community, which should work together to structure its growth. With all the industry buzz surrounding data visualization and its current toolset, it can sometimes be easy to forget that the practice extends at least as far back as that of map-making.
Connect: Gamification. By now you’ve likely heard about gamification in business, specifically how it’s meant to engage customers and boost employee productivity.

Many places are treating gamification like a magic wand, able to cure all of a company’s ills while increasing revenues. This might be overstating its effect, but gamification can still have a positive impact on a business, which is why so many organizations are jumping on the bandwagon. The big question remains: is gamification the right move for your business? It’s certainly not the right fit for everyone, so there are some questions you should answer before implementing this latest trend. Box Might Put Its IPO Back In The Box. Box was rumored to have filed to go public on January 31.
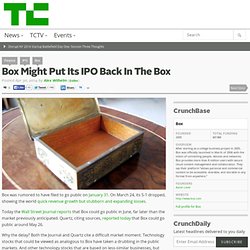
On March 24, its S-1 dropped, showing the world quick revenue growth but stubborn and expanding losses. Today the Wall Street Journal reports that Box could go public in June, far later than the market previously anticipated. Quartz, citing sources, reported today that Box could go public around May 26. Why the delay? Both the Journal and Quartz cite a difficult market moment. If they fall, Box’s IPO share pricing falls. Oracle Announces Its Cross-Platform Marketing Cloud. Oracle today announced the launch of the Oracle Marketing Cloud, a platform that combines technology from a number of the company’s acquisitions, including Eloqua, Compendium, Responsys, and BlueKai.
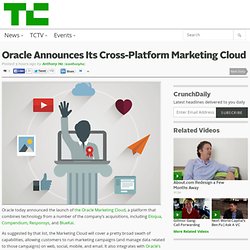
As suggested by that list, the Marketing Cloud will cover a pretty broad swath of capabilities, allowing customers to run marketing campaigns (and manage data related to those campaigns) on web, social, mobile, and email. It also integrates with Oracle’s existing Social Cloud , and includes tools for content marketing. ChainLink Research : Our World View. Les défis Cross-platform. Information Visualization for Knowledge Discovery. Big Data Week Data Visualization London - Francesco D'Orazio "10 reasons why we visualize data" Stories Through Data. Information Visualization on the Move. A Brief and Initial Overview. As new symbionts, tablet devices are part of our life by now.

We are researching on data visualization and interaction on these devices and focusing on actual and future perspectives for dataviz. Looking for mobile applications that convey information in a visual way, we found different tools for different purposes: Reference: applications that visualize data as tools for share knowledge about specific topics as well as encyclopedic information.Business: tools that allow users to visualize and control dynamics of data (mainly financial).Entertainment: applications created for show, group, share or collect information about music, sports, movies or social networks. We noticed that reference and entertainment applications are more experimental than business apps, trying to take advantage from the specific types of interaction allowed by the device.
We present here a first selection of examples of these applications, grouped by the three main purposes. Why data visualization matters. Let’s say you need to understand thousands or even millions of rows of data, and you have a short time to do it in.
The data may come from your team, in which case perhaps you’re already familiar with what it’s measuring and what the results are likely to be. Or it may come from another team, or maybe several teams at once, and be completely unfamiliar. Either way, the reason you’re looking at it is that you have a decision to make, and you want to be informed by the data before making it. Something probably hangs in the balance: a customer, a product, or a profit. Mondrian - Interactive Statistical Data Visualization in JAVA. How To Choose 'Advanced' Data Visualization Tools - Software - Big data and analytical capabilities are the latest coveted features in a fast-growing market for charts, maps, and other ways to visually sort through data for insight.
Report - Big Data in Big Companies. Big data is one of the most promising business trends of the decade, yet it invites as many new questions as it does opportunities: What is big data? How is it different than what we've done? Where do we begin? Big Data in Big Companies, a joint research report by Tom Davenport and Jill Dyché, offers answers, uncovering groundbreaking insights along the way about big data analytics strategies from some of the largest and most successful organizations. Executive perspectives on sweeping change Extensive interviews with executives at 20 companies across a range of industries reveal: Key big data analytics initiatives. Read their research findings to learn why your organization needs to better understand that big data means a dramatic change in skills, leadership, organizational structures, technologies and architectures. About the Authors Noted speaker and author Jill Dyché is Vice President of Best Practices at SAS.
Basho (Basho Technologies) Riak. Build Cloud Storage: The Significance of Hadoop running on OpenStack Swift. The folks at BigDataCraft are working on integrating Hadoop with OpenStack Swift; see for more. This is really exciting! Most readers might ask the obvious question - Hadoop already runs very well on HDFS. Why would running it on top of Swift be of any interest at all? There are two ways to answer this question. DmitryMezhensky/Hadoop-and-Swift-integration. Deploy an OpenStack private cloud to a Hadoop MapReduce environment.