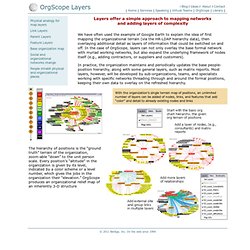

Gephi, an open source graph visualization and manipulation software. OrgScope Layers map complex organization networks. The hierarchy of positions is the “ground truth” terrain of the organization, zoom-able “down” to the unit person scale.

Every position’s “altitude” in the organization is given by its level, indicated by a color scheme or a level number, which gives the jobs in the organization their “elevation.” OrgScope produces an organizational relief map of an inherently 3-D structure With the organization’s single terrain map of positions, an unlimited number of layers can be added of nodes, links, and features that add “color” and detail to already existing nodes and links Layers offer a simple approach to mapping networks and adding layers of complexity We have often used the example of Google Earth to explain the idea of first mapping the organizational terrain (via the HR-LDAP hierarchy data), then overlaying additional detail as layers of information that could be switched on and off.
Flex: Social Graph Browser with Favicons : netthreads. There is a new version of the Social Graph Browser application.
This now has added ‘favicon’ goodness! After all the graft required to add support for 4,8 and 24bpp bitmap types to the flexlib IconLoader class I wasn’t sure if it was going to be worth all the groundwork but I have to say I reckon this looks pretty good. Mentionmap - A Twitter Visualization.