

Stakeholdermotivation im Requirements-Engineering - SwissQ Consulting AG. Dies ist der zweite Teil meiner Blogreihe.
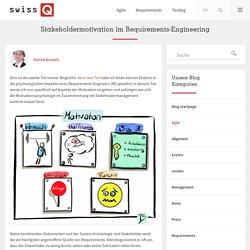
Im ersten Teil habe ich einen kleinen Einblick in die psychologischen Aspekte eines Requirements-Engineers (RE) gewährt, in diesem Teil werde ich nun spezifisch auf Aspekte der Motivation eingehen und aufzeigen wie sich die Motivationspsychologie im Zusammenhang mit Stakeholdermanagement konkret nutzen lässt. Nebst bestehenden Dokumenten und der System Archäologie sind Stakeholder wohl die am häufigsten angetroffene Quelle von Requirements. Allerdings kommt es oft vor, dass die Stakeholder zu wenig Anreiz sehen oder keine Zeit haben nebst ihrem Alltagsgeschäft zusätzlich an einem Produkt mitzuwirken.
Trotzdem sind wir stark auf die Mitarbeit unserer Stakeholder angewiesen. Denn nur mit ihrer Hilfe können wir die Qualität des zu entwickelnden Produktes sicherstellen. LinkedIn. How to Find the Real Need with Socratic Questioning - KBP Media - Anatomy of a Modern Dashboard. Modern dashboards contain summarized and interactive visualizations, and when done correctly, should effectively communicate performance.
This guiding principle hasn’t changed in the last 10 years as the popularity of dashboards and data visualization soared. However, the technology choices, features, and approaches have advanced. Mobility, cloud and data exploration technologies have helped expand the persons who can create and consume dashboards. A dashboard initiative that starts with data and tools, is likely to end in failure. This article won’t tell you how to plan or implement a dashboard, but before analyzing the anatomy of a dashboard, you should evaluate your dashboard approach with answers to the following questions: WHO will consume information in dashboards and who will create them? The ultimate dashboard tool / platform does not exist yet. 1. Image Source: Antivia DecisonPoint 2. Image Source: Microsoft: PowerBI 3. Image Source: DataBox 4. Image Source: Domo 5. Feature Mapping – a simpler path from stories to executable acceptance criteria.
AgileBI vs BEAM✲ vs Modelstorming. Feeling out of your element, dude?
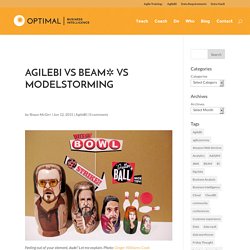
Let me explain. Photo: Ginger Williams-Cook We’ve been blogging a lot recently about AgileBI, BEAM✲ and Modelstorming, and we use those terms somewhat interchangeably. I’ll use this post to help you through the maze of terminology. The first thing to note is these terms are a hierarchy: each fits nicely inside the next. Agiles Requirements Engineering (RE) - Das agile Unternehmen. How to identify a good KPI. The Rule of Thumb for BOBJ Tool Selection. What is the right SAP BusinessObjects frontend for a given situation?
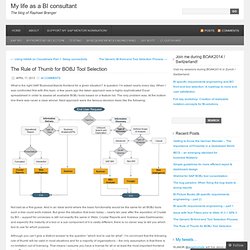
A question I’m asked nearly every day. When I was confronted first with this topic a few years ago the taken approach was a highly sophisticated Excel spreadsheet in order to assess all available BOBJ tools based on a feature list. The only problem was: At the bottom line there was never a clear winner. Next approach were the famous decision trees like the following: Not bad as a first guess. Although you can’t give a distinct answer to the question “which tool to use for what”, I’m convinced that the following rule of thumb will be valid in most situations and for a majority of organisations – the only assumption is that there is no limitation out of licensing. Here is my rule of thumb: The Generic BI front-end Tool Selection Process. Finally – I’m blogging again.
Time flew by and “my life as a BI consultant” kept me busy with migrations from Oracle to Teradata or from BO XI 3.1 SP2 to SP6. Or maybe you’ve also heard about our BusinessObjects Arbeitskreis (can be translated as “workshop”), I’d call this the “only BOBJ dedicated conference in Europe”: www.boak.ch It was a pleasure to build and execute an interesting agenda for our participants as well as welcoming great people like Jason Rose, Mani Srini, Saurabh Abhyankar, Mico Yuk or Carsten Bange.
I also had the pleasure to do the closing key note during BOAK. It was around BOBJ front-end Tool Selection. I used this opportunity to further develop a generic yet simple method how to approach the frontend tool selection. BI Picture Books (BI specific requirements engineering – part 2) Part 1 of this article you’ll find here.
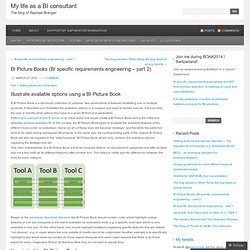
Illustrate available options using a BI Picture Book A BI Picture Book is a structured collection of “pictures” aka screenshots of features illustrating one or multiple products. It describes and illustrates the available options in a compact and easy to handle manual. It should help the user to identify what options they have in a given BI front end application.Referring to scenario A and B above, in an ideal world one would create a BI Picture Book during the initial tool selection process (scenario B).
In this context, the BI Picture Book helps to illustrate the available features of the different tools under consideration. Based on the previously described structure, the BI Picture Book should contain notes which highlight unique features of one tool compared to the rest of available (or evaluated) tools, e.g. a specific chart type which is only available in one tool. BI specific requirements engineering – part 1. (Thanks to my co-author Alexander van’t Wout for supporting me writing this blog post!)
Collecting requirements for BI front end tools is often frustrating. Imagine a sales conversation at your local car dealer. After some small talk you are going to tell the salesperson about your interest in buying a brand new car. Nothing easier than this you might think. But suddenly you are confused. This is how many Business Intelligence (BI) experts deal with their customers today. Comparing Web Intelligence and SAP BusinessObjects Analysis - Part 1. It is now several years that SAP and BusinessObjects are “under one roof”, but it seems that especially when it comes to selecting the “right” BI client for SAP NetWeaver BW that there are still lots of customers that always try to do everything with Web Intelligence and then later on realize that there are a lot of limitations.
A lot of you have probably heard me talking about how you can use your requirements to find the best choice for the BI tool but it seems that especially the choice between Web Intelligence and SAP BusinessObjects Analysis, edition for Microsoft Office or SAP BusinessObjects Analysis, edition for OLAP is a “difficult” choice. So I thought that in a set of blog posts I outline the major differences and major limitations of both products and we will start with hierarchical workflows as that is something very important in case you are using SAP NetWeaver BW as data source. In this post we will look at the usage of a single hierarchy in both products.
Mico Yuk Explains How BI Storyboards Can Increase User Buy-In. Trends und Hürden im Requirements Engineering. Wie werden Anforderungen analysiert?
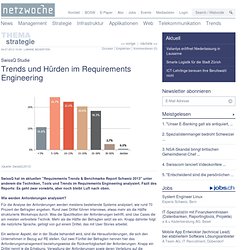
Für die Analyse der Anforderungen werden meistens bestehende Systeme analysiert, wie rund 70 Prozent der Befragten angeben. Rund zwei Drittel führen Interviews, etwas mehr als die Hälfte strukturierte Workshops durch.