
Conditional Scheduling in SAP BI Web Intelligence. Unlike in Crystal Reports, In SAP Web Intelligence, it is not possible to schedule based on conditions.
However, often times you can accomplish this with the Publications as follows. Contents Introduction. 1 Conclusion In our sample, we will use the eFashion sample Universe / Database. The sample business case is: An example of visual analytics in Web Intelligence. Whilst Web Intelligence (Webi) may not necessarily the first tool which comes to mind for developing visually engaging analytics, with some creative flare, we’re not limited to delivering analytics and reports in Webi that appears as mainly of tables and crosstabs.
The purpose of this post is to share some visualisation techniques which I’ve used whilst developing some Web Intelligence (Webi) reports which have a slight dashboard flavour. Please bear in mind whilst reading through that the primary focus of this post is not on tool selection nor discussing the strengths/weaknesses and features of Webi in comparison to the other tools within the BusinessObjects product suite.
This post is purely intended to showcase some visualisation techniques which can be achieved using WebI and providing some tips and tricks on how they were achieved. Overview 1. 2. 3. Creating the Tiles Take the Winners tile for instance: BETA Customers needed: Web Intelligence Calcula... Picture this: You have just completed an upgrade of your BI Platform environment and you are now seeing some big changes to your Web Intelligence documents.
For some of you, this may have been a reality in the past. How to avoid/solve 20% of your Webi incidents ! Guidelines for designing Webi Reports for SAP B... What is Mobile Page Layout?
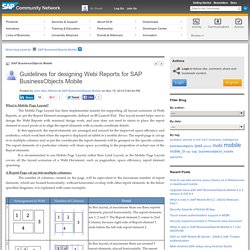
The Mobile Page Layout has been implemented mainly for supporting all layout scenarios of Webi Reports, as per the Report Element arrangements, defined on BI Launch-Pad. This layout model helps user to design the Webi Reports with minimal design work, and user does not need to strain to place the report element in exact pixels or to align the report elements with accurate coordinate details. In this approach, the report elements are arranged and resized for the improved space efficiency and aesthetics, which work best when the report is displayed on tablet or a mobile device. The report page is cut up in to multiple columns and as per the coordinates the report elements will be grouped on the specific column. The report elements of a particular column will share space according to the proportion of actual size of the Report elements.
The Webi Bulletin. SAP BI 4.1 SP6 - What's New in Web Intelligence... The SAP BI 4.1 Support Package 6 will be released later this month.
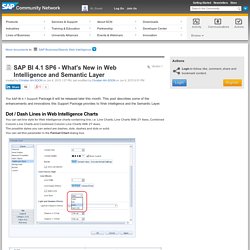
This post describes some of the enhancements and innovations this Support Package provides to Web Intelligence and the Semantic Layer. Dot / Dash Lines in Web Intelligence Charts You can set line style for Web Intelligence charts containing line, i.e. Line Charts, Line Charts With 2Y Axes, Combined Column Line Charts and Combined Column Line Charts With 2Y Axes.The possible styles you can select are dashes, dots, dashes and dots or solid. You can set this parameter in the Format Chart dialog box.
You can also select a line style for each line by individually selecting a line in the chart and right-clicking it. Print Settings in the Web Intelligence DHTML Client The Web Intelligence DTHML client Print dialog box supports new parameters for printing. Multi-Column Selection in Web Intelligence Report Tables You can select several columns via the usual Shift+click and Control+click keyboard shortcuts. Document Input Control. Creating Histograms in Web Intelligence with Adjustable Bucket Sizes. Introduction This article looks at how to create a histogram in Web Intelligence and makes use of input controls to allow the user to automatically adjust the histogram’s bucket size.
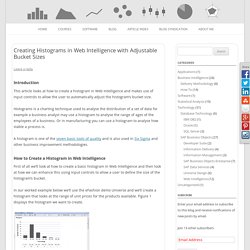
Histograms is a charting technique used to analyse the distribution of a set of data for example a business analyst may use a histogram to analyse the range of ages of the employees of a business. Or in manufacturing you can use a histogram to analyse how stable a process is. A histogram is one of the seven basic tools of quality and is also used in Six Sigma and other business improvement methodologies. Displaying WebI report parts via openDocument i... This first blog post of mine will briefly describe how one can view just one report part (chart, table, free-cell, etc.) of a WebI document in a custom web app via the openDocument interface of a SBOP BI 4.0 platform.
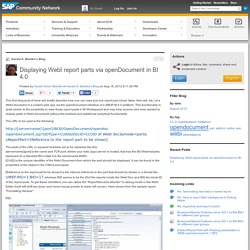
This functionality is quite similar to the possibility to view those report parts in BI Workspaces and may help anyone who ever wanted to display parts of WebI documents without the toolbars and additional analytical functionality. The URL to be used is the following: of WebI doc]&mode=part&sReportPart=[Reference to the report part to be shown] The parts of the URL in squared brackets are to be replaced like this: [servername]:[port] is the name and TCP-port, where your web (app) server is hosted, that has the BO Webmodules deployed (In a standard BO install it is the servername:8080) [CUID] is the unique identifier of the WebI Document from which the part should be displayed.
So the final URL on my test-system looks like: Guidelines for designing Webi Reports for SAP B... Webi 4.x tricks : Overview of Tricks. Hi everyone, I am pleased to share with you some tips on the advanced use of Web Intelligence.
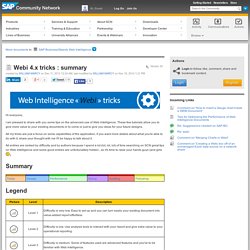
These few tutorials allow you to give more value to your existing documents or to come or just to give you ideas for your future designs. All my tricks are just a focus on some capabilities of the application, if you want more details about what you're able to do with it, share your thought with me I'll be happy to talk about it. All entries are ranked by difficulty and by authors because I spend a lot (lot, lot, lot) of time searching on SCN great tips on Web Intelligence and some good entries are unfortunaltely hidden...so it's time to raise your hands guys (and girls This section will help you designing the structure of your Web Intelligence document. Sample Files for Web Intelligence Training Course. Displaying WebI report parts via openDocument i... WebiAdminTool. This tool is an internal tool for SAP employees.
SAP will not provide any form of assistance to customers with using this tool. It is an unsupported tool.However, the tool can still be used by customers to help diagnose issues and improve understanding to what the server is doing.SAP does not expect any adverse affects from using this tool in any environment, however the tool should be used with care since its particularly powerful and intended for those with already a good understanding of Web Intelligence. cd "C:\Program Files (x86)\SAP BusinessObjects\SAP BusinessObjects Enterprise XI 4.0\java\apps\WebiAdminTool" "C:\Program Files (x86)\Java\jre7\bin\java.exe" -jar GenericContainer_AdminTool.jar Login with a user with Administrator rights.
You will then be presented with the 'Servers Dashboard' (shown above). Each of these is described the following sections: Server Instance Manager: On the left hand side all the Web Intelligence Server instances will be shown in the cluster. Monitoring. Guidelines for designing Webi Reports for SAP B... Tips for Optimizing the Performance of Web Inte... DRAFT DISCLAIMER - This document is a work in progress and will be released 1 chapter at a time.
Please follow, bookmark and subscribe to updates to ensure you are notified of the latest changes. It is also a living document and we would love to hear your feedback and tips & tricks! Comment or private message anything you would like to see added, changed or removed. Creating Histograms in Web Intelligence with Adjustable Bucket Sizes. A (Webi) dashboard built by a business (power) user. This blog post is inspired by a recent customer request to challenge their decision to use Design Studio for some “dashboard requirements”. Showing how you can create a dashboard in Webi doesn’t mean I told the customer not to use Design Studio. Much more it is to show that finally a dashboard as well as every other type of BI front end solution is made up of requirements and not primarily by the tool you build the solution. Please refer to my Generic Tool Selection Process for more details as well as my post regarding BI specific requirements engineering.
Having said this, let’s have a look at how we can use latest Webi 4.1 features to quickly build an interactive dashboard without the need of (much) scripting. First of all here is what the final result looks like: You can select values from the left side bar (Product Lines), you can select States by directly clicking into the table and you can switch from the bar chart to a line chart. Here the formula for copy / paste: Altek Solutions Business Intelligence Blog. One of the Features in Web Intelligence 3.x and 4.x version for filtering and interacting on report data elements in the report is Input Controls. In this session, let’s look into the available Input Controls and how they operate.
In Web Intelligence XI R2, developers were allowed to use a blank cell in which JavaScript was embedded to create HTML Components into the report which, with additional programming, allowed interaction. The basic idea was to format the report with saved data to form a hybrid dashboard for interaction. This attempt to use a Web Intelligence Report as hybrid Dashboard is now much easier to create using Input Control Elements in the newer versions. First, lets look at the list of Input Controls between 3.1 version and 4.1 version as shown below: As shown in the figure, we have Input Controls namely, Entry Field, Combo Box, Radio Buttons, List Box, Calendar, Spinner, Simple Slider and Multiple value Input Controls namely Check Box, List Box, Double Slider.
Webi tricks : Interactive selecting and viewing... Hi everyone, In this trick I will show you how to dynamically display data tables with differents ranks in Read mode without entering in Design mode. Application : Web Intelligence 4.1 SP2 Use Case : I want to dynamically see on the same report, all my datas and add a ranking with different TOPn without editing the document in Read mode. Insert your first table with all data displayed. BOBJ Tricks: Waterfall Charts in Webi. Although waterfall charts are not an option in Webi, with a little trickery it's possible to create something that looks and behaves as a waterfall chart should.
I’m Using BOBJ XI3.1 SP3 InfoView/Webi I’m Assuming You know your way around Webi Here’s the end result: My data set is quite simple. Web Intelligence 4.1 SP3: Applet (Java) vs. HTML. Introduction Web Intelligence documents can be created, edited or consumed via three different interfaces: HTMLApplet (Java)Desktop (Rich Client) The following blog post is a feature comparison of the two web-based modes (HTML & Applet) on the latest version currently available (BI 4.1 SP03). Select a Data Source Data sources specific to Applet (Java): Excel, BEx & Analysis View. Document Linking Wizard HTML is the only interface that offers a "Document Linking Wizard" within the [Report Elements] tab.Leveraging OpenDocument syntax is still possible in the Applet (Java) interface but must be entered manually.Note: While Web Intelligence documents based on BEx must be created in Applet (Java) mode, developers can still leverage the HTML specific document linking feature by viewing a Web Intelligence/BEx report and switching to "Design" mode.
Conditional Formatting Only Applet (Java) can create new formatting rules. Data Source Management. FAQ about SAP BI4 WebIntelligence on HANA. As part of Customer Adoption & Enablement focusing on BI4 analytics suite, my colleague (David Francois Gonzalez) and I started this little FAQ on WebIntelligence on HANA. Some questions may look simplistic and common sense, but we hope this sheds light and sets the right expectations when using these great technologies. Dallas Marks Blog. Webi Hack: Updating the color palette for a single report. Migration BI Clients Deski2Webi. SAP CAA - SAP BO Web Intelligence XI 3.x. Bars Embeded into rows Web Intelligence.