
Disasters. Crowdmap. Gallery. Sub-Sort Natural Disasters by: Name / Path / Row / Latitude / Longitude / Sensor / Date Posted Return to Map Landslide near Oso, WashingtonSensor: L8 OLIPath/Row: 47/26Lat/Long: 48.900/-122.800Category: Natural DisastersDownload High ResolutionDate Posted: 04/02/2014 Grampians Fire, AustraliaSensor: L8 OLIPath/Row: 94/86Lat/Long: -37.500/142.800Category: Natural DisastersDownload High ResolutionDate Posted: 02/13/2014 Agno River Valley flooding, Philippines (Typhoon Haiyan)Sensor: L8 OLI, L7 ETM+Path/Row: 116/48Lat/Long: 17.300/121.500Category: Natural DisastersDownload High ResolutionDate Posted: 11/14/2013 Flooding in CambodiaSensor: L8 OLIPath/Row: 126/51, 52Lat/Long: 12.2/104.8Category: Natural DisastersDownload High ResolutionDate Posted: 11/01/2013.
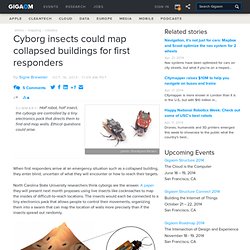
Cyborg insects could map collapsed buildings for first responders. When first responders arrive at an emergency situation such as a collapsed building, they enter blind, uncertain of what they will encounter or how to reach their targets.

North Carolina State University researchers think cyborgs are the answer. A paper they will present next month proposes using live insects like cockroaches to map the insides of difficult-to-reach locations. The insects would each be connected to a tiny electronics pack that allows people to control their movements, organizing them into a swarm that can map the location of walls more precisely than if the insects spread out randomly. “We focused on how to map areas where you have little or no precise information on where each biobot is, such as a collapsed building where you can’t use GPS technology,” senior paper author Edgar Lobaton said in a release.
“One characteristic of biobots is that their movement can be somewhat random. Case 1 and 2 show natural swarm movement, where insects spread out evenly over time. Blog » Hexbins! Binning is a general term for grouping a dataset of N values into less than N discrete groups.

These groups/bins may be spatial, temporal, or otherwise attribute-based. In this post I’m only talking about spatial (long-lat) and 2-dimensional attribute-based (scatterplot) bins. Such binnings may be thought of as 2D histograms. This may make more or less sense after what lies beneath. If you’re just after that sweet honey that is my code, bear down on my Github repository for this project — hexbin-js. Rectangular binning The simplest 2D bin is rectangular. The above is a shot from a little example I produced on jsFiddle, while learning Mike Bostock’s fantastic D3 JavaScript library for HTML and SVG data-binding and visualization. Binning can be good for both the users and the creators/developers of static or interactive thematic maps or other visualizations. So anyway, binned representations can be beneficial for both users and creators. MapBox. ShakeMaps.
Main Page - GeoRSS. Flex API Code Gallery - ArcGIS API for Flex. API for Flex. Wiki. Map Viewer. Disease Outbreak News. Earthquakes - 7 days, M2.5+ Natural Hazards Support System (NHSS) Daily Hazards Briefing. Storm Prediction Center. A Map of the World That Reveals Natural Disaster Hot Zones. Global Disaster Alert and Coordination System. Emergency and Disaster Information Service.
World Natural Disaster Information, Earthquakes, Floods, Hurricane, Typhoon,