
The Urbanophile. The Urbanophile » Demographic Analysis. Thursday, April 10th, 2014 Building a More Dynamic Cincinnati This post originally appeared in the Cincinnati Enquirer on April 8, 2014.
Cincinnati arguably has the greatest collection of assets of any city its size in America. So why has the region been stagnant to slow-growing for so many decades? When you look at the stunning collection of advantages and assets of Cincinnati – its geography; the amazing dense, historic architecture (great contemporary architecture, too); top-notch cultural institutions; a large corporate presence; and so many pieces of local culture and flavor of a type that has been homogenized away in most places – it’s an embarrassment of riches.
Yet since 1970, while the U.S. has grown by nearly 52 percent in population, the Cincinnati region grew by 26 percent, only half as fast. How is this? Part of it is that all the assets in the world don’t help you if you don’t take advantage of them. Friday, April 4th, 2014 Census Bureau Releases Updated Population Estimates 1. Data visualizations vs. infographics: Why the difference matters. You've heard the terms "data visualization" and "infographic"--but are they the same thing?
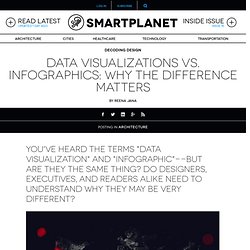
Do designers, executives, and readers alike need to understand why they may be very different? In an era of visual thinkers, a growing awareness of the power of design, and a proliferation of data, untangling the difference between various types of graphs can be a helpful exercise for businesses and designers alike. Two terms that are thrown around a lot these days are "data visualization" and "infographic. " Are these two genres interchangeable? And are there some instances when one type of graphic might be more appropriate than others? The trend-watching site PSFK recently published (on May 5) an interview with Max Gadney, founder and design director of London-based data-design company After the Flood, tacking these very questions.
"Data visualizations require more work and sifting by a user, in order to find patterns and insight," Gadney said in the PSFK interview. [Via PSFK] Seven rules for predicting future innovations. Top 29: Best Cities 2011. #1 Barcelona - Top 29 Cities. Arguably edgier and more bohemian than Madrid, Barcelona is Catalonia's bastion of urban cool.

And as you’d expect from a city that enjoys a warm Mediterranean climate, living takes place very much outdoors. From dining on tapas alfresco on La Rambla to basking in the sun on Barceloneta, out is the new in, and being cooped up in Gaudi-inspired, Gothic-style buildings (however breathtakingly beautiful) is only for the old, retired or, dare we say it, muertos. "Edgier and more bohemian than Madrid, Barcelona is Catalonia's bastion of urban cool.
" The Enabling City - Crowdfunded Communities. This post is part of Thesis Chronicles.
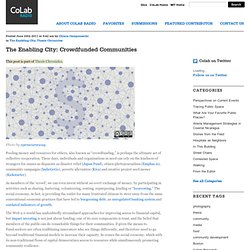
Photo by opensourceway. Pooling money and resources for others, also known as “crowdfunding,” is perhaps the ultimate act of collective cooperation. These days, individuals and organizations in need can rely on the kindness of strangers for causes as disparate as disaster relief (Japan Fund), citizen photojournalism (Emphas.is), community campaigns (IndieGoGo), poverty alleviation (Kiva) and creative project seed money (Kickstarter).
50 Ideas for the New City. The Omnibus is all about ideas.
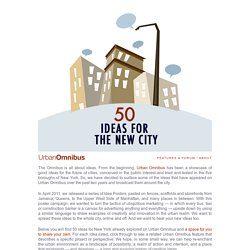
From the beginning, Urban Omnibus has been a showcase of good ideas for the future of cities, conceived in the public interest and tried and tested in the five boroughs of New York. So, we have decided to surface some of the ideas that have appeared on Urban Omnibus over the past two years and broadcast them around the city. In April 2011, we released a series of Idea Posters, pasted on fences, scaffolds and storefronts from Jamaica, Queens, to the Upper West Side of Manhattan, and many places in between. With this poster campaign, we wanted to turn the tactics of ubiquitous marketing — in which every bus, taxi or construction barrier is a canvas for advertising anything and everything — upside down by using a similar language to share examples of creativity and innovation in the urban realm.
We want to spread these ideas to the whole city, online and off. OpenCities.