

El Visual Thinking en el ámbito educativo. En la era digital vivimos una época en la que la experiencia visual es una de las principales formas de acercamiento al saber.
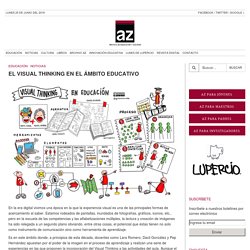
Estamos rodeados de pantallas, inundados de fotografías, gráficos, iconos, etc., pero en la escuela de las competencias y las alfabetizaciones múltiples, la lectura y creación de imágenes ha sido relegada a un segundo plano obviando, entre otras cosas, el potencial que éstas tienen no solo como instrumento de comunicación sino como herramienta de aprendizaje. Es en este ámbito donde, a principios de esta década, docentes como Lara Romero, Dacil González y Pep Hernández apuestan por el poder de la imagen en el proceso de aprendizaje y realizan una serie de experiencias en las que proponen la incorporación del Visual Thinking a las actividades del aula. Aunque el movimiento es incipiente, ya en el curso 2012-2013 comienza a generarse cierto movimiento en torno al uso de la herramienta en el ámbito docente.
MetaTreeMap: An Alternative Visualization Method for Displaying Metagenomic Phylogenic Trees. Abstract Metagenomic samples can contain hundreds or thousands of different species.
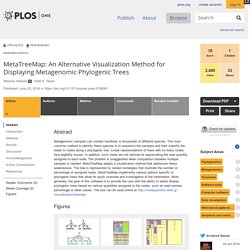
The most common method to identify these species is to sequence the samples and then classify the reads to nodes along a phylogenic tree. Linear representations of trees with so many nodes face legibility issues. In addition, such views are not optimal for appreciating the read quantity assigned to each node. The problem is exaggerated when comparison between multiple samples is needed. Citation: Hebrard M, Taylor TD (2016) MetaTreeMap: An Alternative Visualization Method for Displaying Metagenomic Phylogenic Trees. Editor: John Parkinson, Hospital for Sick Children, CANADA Received: January 31, 2016; Accepted: June 13, 2016; Published: June 23, 2016 Copyright: © 2016 Hebrard, Taylor.
Data Availability: The software can be used online without any limitations at The sources can be found at Funding: This work was supported by the operational expenditure fund of RIKEN. Introduction Methods Fig 1. Results. TreeMap interactive data visualization software. 15 Data Visualizations That Will Blow Your Mind. 20 superb data visualisation tools for web designers. NOTE: You'll find an updated version of this article here One of the most common questions I get asked is how to get started with data visualisations.

Beyond following blogs, you need to practise – and to practise, you need to understand the tools available. In this article, I want to introduce you to 20 different tools for creating visualisations: from simple charts to complex graphs, maps and infographics. Almost everything here is available for free, and some you have probably installed already. Entry-level tools At the entry level, we'll be looking at unexpected uses for familiar tools. 01. You can actually do some pretty complex things with Excel, from 'heat maps' of cells to scatter plots. Excel comes as part of the commercial Microsoft Office suite, so if you don't have access to it, Google's spreadsheets – part of Google Docs and Google Drive – can do many of the same things.
Online visualisations 03. 04. Flot is a great library for line graphs and bar charts. 05. 07. 31 Free Data Visualization Tools. Mastering the data is only half the battle.
You still need data visualization tools and data storytelling techniques to explain what you’ve discovered. For instance, you can deploy a fascinating image or some interactive media to instantly engage your audience and breathe life into your data-driven concepts, even if you have no experience in art or graphic design. All of these data visualization tools are available for free, but many have a premium version if you want to upgrade and access more options. Free Data Visualization Tools 1. Work online with Visualize Free and its drag-and-drop designer. 2.
The name D3.js is short for “Data Driven Documents.” 3. You don’t have to be a JS expert to use the Raw interface on top of the D3.js library. 13 Free Data Visualization Tools. List of phylogenetic tree visualization software. This list of phylogenetic tree viewing software is a compilation of software tools and web portals used in visualising phylogenetic trees.
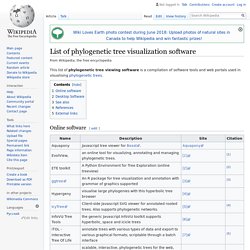
Online software[edit] Desktop Software[edit] 1 "All" refers to Microsoft Windows, Apple OSX and Linux; L=Linux, M=Apple Mac, W=Microsoft Windows See also[edit] List of phylogenetics software References[edit] External links[edit] Network Visualization Archives - dataviz.tools. 22 Free and Open Source Data Visualization Tools to Grow Your Business. A free data-visualization tool can mean the difference between quickly understanding the health of your company or slogging through information.
Data visualization shouldn’t just present bare data, it should tell a story to the reader that makes the data easier to understand. Gartner analyst Martin Kihn puts it well: “Static data—statistics alone—will persuade few. The visualization must communicate a situation that is having an impact and warrants a thoughtful decision. The visualization has to show some kind of movement. Visualize Data, Together. Online JSON Tree Viewer. iTOL: Interactive Tree Of Life. EvolView, an online tool for visualizing, annotating and managing phylogenetic trees. RAWGraphs. Tree viewer - Online visualization of phylogenetic trees (newick) and alignments.