

NASA Earth Observatory : Home Greatest Hits from Landsat : Feature Articles Deforestation in the Amazon Rainforest takes on many different patterns. In Rondônia, a state in Western Brazil, deforestation took on the fishbone pattern revealed in these Landsat images from 1975 and 2012. Access to this remote region began with the building of a major road stretching from north to south. Secondary roads were then slowly cut through the dense forest at right angles to the initial road. “Because these roads cut deep into the rainforest and then spread outwards, there’s a much greater loss of habitat and species than if there was a single area of deforestation because the amount of edge is critical for biodiversity,” said Compton Tucker, a biologist at NASA’s Goddard Space Flight Center. Tucker says this biodiversity paradox can largely be attributed to the fishbone pattern of deforestation, as it creates many more exposed edges between deforested areas and intact forest.
Astronomy Picture of the Day Discover the cosmos! Each day a different image or photograph of our fascinating universe is featured, along with a brief explanation written by a professional astronomer. 2016 April 15 Mercury and Crescent Moon Set Image Credit & Copyright: Miguel Claro (TWAN, Dark Sky Alqueva) Explanation: Innermost planet Mercury and a thin crescent Moon are never found far from the Sun in planet Earth's skies. Tomorrow's picture: Heliopause Electrostatic Rapid Transit System Authors & editors: Robert Nemiroff (MTU) & Jerry Bonnell (UMCP)NASA Official: Phillip Newman Specific rights apply.NASA Web Privacy Policy and Important NoticesA service of:ASD at NASA / GSFC& Michigan Tech.
on reserve The Many Hues of London The Enhanced Thematic Mapper Plus (ETM+), the sole instrument on the Landsat 7 satellite, is far more than a camera. While a typical point-and-shoot digital camera takes one picture of a scene based on information from the visible portion of the electromagnetic spectrum, the ETM+ generates eight separate views of everything it images. The ETM+ senses electromagnetic radiation in seven different bands, plus an additional panchromatic band that combines a broad range of wavelengths to create a high-resolution image. Three of them (bands 1, 2, 3) are in the visible portion of the spectrum and correspond to blue, green, and red light. Combining the three visible bands produces a natural-color view, such as the top image of London. In the middle image, data from one of the infrared bands (4) has been combined with the green (3) and blue (2) bands to create a 4-3-2 false-color view of London. Instrument(s): Landsat 7 - ETM+
Big News From Mars? Rover Scientists Mum For Now hide captionNASA's Mars rover Curiosity dug up five scoops of sand from a patch nicknamed "Rocknest." A suite of instruments called SAM analyzed Martian soil samples, but the findings have not yet been released. NASA/JPL-Caltech Scientists working on NASA's six-wheeled rover on Mars have a problem. They have some exciting new results from one of the rover's instruments. It's a bind scientists frequently find themselves in, because by their nature, scientists like to share their results. The exciting results are coming from an instrument in the rover called SAM. SAM is a kind of miniature chemistry lab. Grotzinger says they recently put a soil sample in SAM, and the analysis shows something remarkable. Grotzinger can see the pained look on my face as I wait, hoping he'll tell me what the heck he's found, but he's not providing any more information. So why doesn't Grotzinger want to share his exciting news? It wasn't scientific caution that kept Zare from announcing his results.
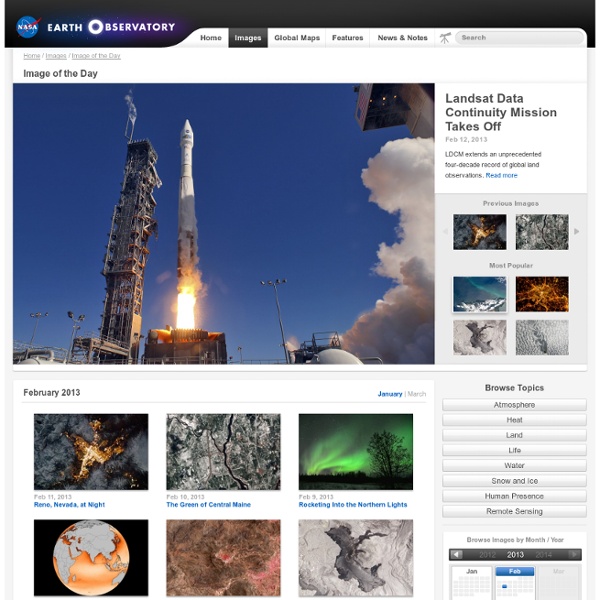
to reclass First of Three Million Forty years ago, after more than a decade working to leave our planet, NASA launched an unprecedented mission to look back at home. Four decades later, the Landsat program is still going strong, with more than three million images of Earth in its archives and a new mission slated for launch in 2013. On July 23, 1972, the Earth Resources Technology Satellite (later renamed Landsat 1) lifted off on a Thor-Delta (Delta 900) rocket from Vandenberg Air Force Base in California. Scientists involved in the mission weren't sure what to expect of the MSS, which used new fiber-optic technology, took pictures in four different bands of the spectrum, and scanned the Earth in strips. As the imagery scrolled into view, there were clouds...and then more clouds...and then land. Any lingering anxiety in the room quickly turned to excitement, and skeptics were promptly converted into supporters. Read more about the history of the Landsat program in our new feature story: Landsat Looks and Sees.
Sea Ice Retreats in the Northwest Passage Ice retreated rapidly in the Parry Channel—part of the famous and elusive Northwest Passage—between mid-July and early August 2012. These images, acquired by the Moderate Resolution Imaging Spectroradiometer (MODIS) on NASA’s Terra satellite, show significant changes over two weeks. The top image shows Parry Channel on July 17, 2012, when ice filled the channel. The Canadian Ice Service reported that ice cover in Parry Channel began to fall below the 1981–2010 median after July 16, 2012, and the loss accelerated over the following two weeks. These photo-like images show widespread open water in early August, though patches of ice linger south of Melville Island. Whether or not ships can easily pass, recent studies have suggested that certain organisms have begun to take advantage of the open water. Attempts to identify a shortcut between Europe and Asia across the Arctic date back to the late fifteenth century, just several years after Columbus journeyed to the Americas. Instrument(s):