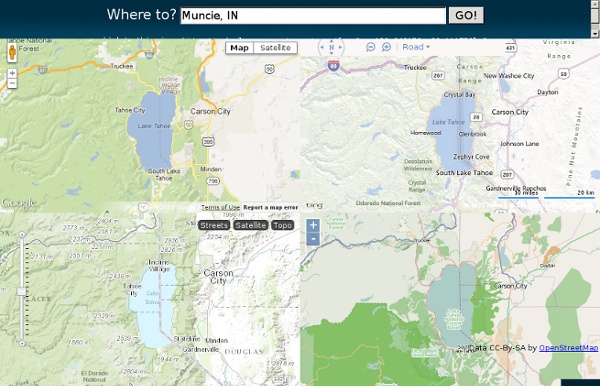


TOPOMAPPER Compare Maps Nutzungsbedingungen Scale = 1 : 111m z:3 2000 km 1000 mi Base Layer Topographic Maps (Zoom In) Google Street Map Google Hybrid Map Google Terrain Map Bing Street Map Bing Hybrid Map Yahoo Street Map Yahoo Hybrid Map OpenStreetMap (Mapnik) OpenStreetMap (Tiles@Home) Map data hosted by Atlogis Topographic Maps (Zoom In) Google Street Map Google Hybrid Map Google Terrain Map Yahoo Street Map Yahoo Hybrid Map OpenStreetMap (Mapnik) OpenStreetMap (Tiles@Home) Click here for URL-Link of this View | Topographic Maps Coverage | Soviet Military Maps Documentation Des cartes interactives pour mieux comprendre les enjeux démographiques | Enseigner l'Histoire-Géographie | Scoop.it L'Institut national d'études démographiques (INED) vient de lancer sur son site une carte interactive de la population mondiale. Un bon exemple de ce que le web permet aujourd'hui en termes de mise en scène de données. L'outil permet de visualiser la carte mondiale avec un indicateur comme le taux de natalité, le PIB, ou bien le taux d'urbanisation, de voir les évolutions depuis 1950, de comparer les courbes des différents pays. Et de mieux comprendre comment la démographie influence la géopolitique. Quel rôle a ainsi joué le facteur démographique dans les révolutions des pays arabes en 2011? Difficile à dire, mais en regardant les courbes démographiques des pays concernés étonnamment similaires, on peut comprendre qu'il s'agit d'un phénomène générationnel commun au monde arabe. Le Proche-Orient s'apprête lui aussi à vivre un bouleversement démographique. Très intuitif, l'outil a été conçu particulièrement pour les enseignant et leurs élèves.
transparent map comparison openstreetmap google bing yahoo Données cartographiques ©2013 - Conditions d'utilisation Base Layer Google Streets Google MapMaker Google Aerial Google Physical Overlays OpenStreetMap Mapnik OSM Mapnik german style OSM Cycle Map ÖPNV Karte Mapquest OSM Hillshading Hiking Map ADFC Bicyclenetwork Map data © OpenStreetMap and contributors CC-BY-SA , NASA SRTM Permalink
La population urbaine mondiale de 1950 à 2050 - carte statistique interactive de l'UNICEF | Enseigner l'Histoire-Géographie 40 maps that explain the world By Max Fisher By Max Fisher August 12, 2013 Maps can be a remarkably powerful tool for understanding the world and how it works, but they show only what you ask them to. So when we saw a post sweeping the Web titled "40 maps they didn't teach you in school," one of which happens to be a WorldViews original, I thought we might be able to contribute our own collection. [Additional read: How Ukraine became Ukraine and 40 more maps that explain the world] Click to enlarge.
40 Maps They Didn’t Teach You In School By the time we graduate high school, we learn that they never taught us the most interesting things in there. Sure, you might be able to name the European countries or point New York on the map, but does that give a you real understanding of how the world functions? To fill this gap, we have gathered a great and informative selection of infographical maps that they should’ve shown us at school: every single one of these maps reveals different fun and interesting facts, which can actually help you draw some pretty interesting conclusions. Show Full Text What makes infographical maps so engaging is how easy it becomes to conceive graphically presented information. Without further ado, we invite you to learn things like most popular sports in different countries, who has the largest breasts, red hair map of Europe, world’s most consumed alcoholic beverages, or which brands dominate in different states of the USA. Trust us, these are way better than the ones they taught you at school!
Histoire et géographie de l'Europe