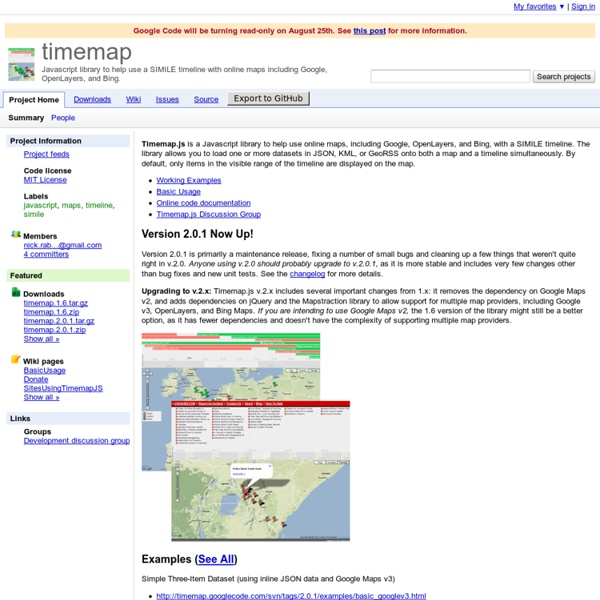
Timemap - Javascript library to help use a SIMILE timeline with online maps including Google, OpenLayers, and Bing.
Vidmap - Geotagging for Videos
Crossfilter
Fast Multidimensional Filtering for Coordinated Views Crossfilter is a JavaScript library for exploring large multivariate datasets in the browser. Crossfilter supports extremely fast (<30ms) interaction with coordinated views, even with datasets containing a million or more records; we built it to power analytics for Square Register, allowing merchants to slice and dice their payment history fluidly. Since most interactions only involve a single dimension, and then only small adjustments are made to the filter values, incremental filtering and reducing is significantly faster than starting from scratch. Crossfilter uses sorted indexes (and a few bit-twiddling hacks) to make this possible, dramatically increasing the performance of live histograms and top-K lists. Example: Airline on-time performance The coordinated visualizations below (built with D3) show nearly a quarter-million flights from early 2001: part of the ASA Data Expo dataset. February 28, 2001 236 mi. +139 min. 304 mi. 569 mi.
Polymaps
Planetary.js: Awesome interactive globes for the web
This code shows the example from the homepage, which rotates, shows randomly positioned, colored, and sized pings on the globe, and supports mouse-based dragging and zooming. It also shows the creation and use of a plugin, which powers the automatic rotation and exposes a public API. We're using a specially-made TopoJSON file that includes lake data so that we can draw lakes on the globe with a custom plugin, which you can find at the bottom of the JavaScript. The demo also shows how you can keep your globe from looking pixelated on high density displays by changing the canvas' width and height but keeping its displayed width and height the same via CSS styling.
Kartograph.org
UW Interactive Data Lab
Create a map | BatchGeo
Comparison of JavaScript Data Visualization Libraries
In my previous review Choice Free JavaScript Data Visualization Library was considered more also 20 popular among developers JavaScript solutions for charts. In addition to a short description and a graphic example each library was considered from a perspectives of the licensing, visualization technology, HTML5 support and capability of the integration with GWT. In this review for Clarity these and additional characteristics combine in a matrix. The intention of this comparison is to show some examples of JavaScript Data Visualization libraries with their different features. Another important aspect which should be considered in the comparison is the support from community (i.e. # of users/developers/commits in last month, etc.) for that JS charting library. Although it is hard to gather this kind of information, I think it is the most valuable for the final decision.
Related:
Related:
