
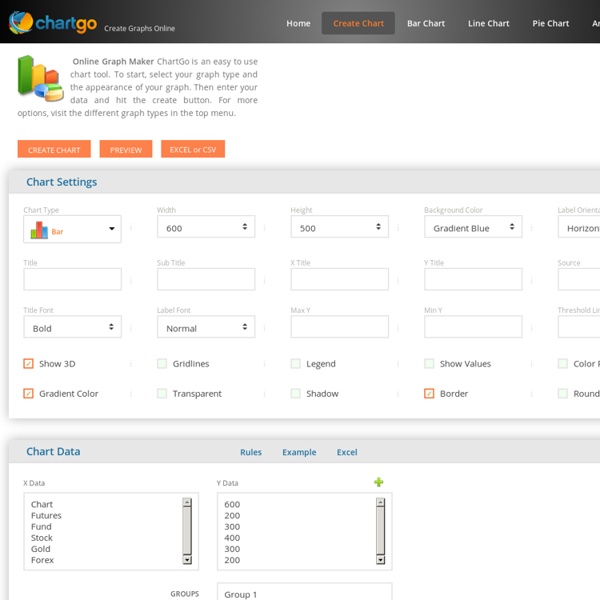
http://www.chartgo.com/index.jsp
Related: Prezentacije, video, timeline, grafikoni, mentalne mapeChartle.net - interactive charts online! Over 1 billion charts, maps, plots and diagrams are found in print publications each year - but only 40 million online. This huge discrepancy is a reflection of the complexity to create & publish charts online. Chartle.net tears down the complexity of online visualizations - offers simplicity, ubiquity and interactivity instead. upcoming features : impressive new Ajax/Flash user interface and improved data import from Excel. your.flowingdata / Capture your life in data. Capture your life in data. One tweet at a time. Get Started Now »
WiseMapping Les meilleurs outils pour gérer vos favoris sur le Net Indispensables pour retrouver vos sites préférés, les favoris deviennent difficiles à gérer lorsqu’ils sont nombreux. Voici des outils pour organiser ce foisonnement. Un tiers du temps passé sur Internet est consacré à la recherche d’informations, selon l’institut Nielsen. D’où l’intérêt de mémoriser l’adresse de vos sites préférés en créant des favoris (également appelés «bookmarks», signets, marque-pages…). Alati za stvaranje mrežnih slikovnica - Školska knjiga - tu za vas Protekloga me tjedna jedan čitatelj portala Free Technology for Teachers zamolio da predložim nekoliko besplatnih alata kojima se učenici mogu koristiti pri izradi slikovnica. To nije neuobičajen zahtjev i uvijek ću rado odgovoriti na takav upit. Odabir i uređivanje slika može biti dobar način pomaganja učenicima u pronalaženju ideje za pisanje priče. Svih pet alata u nastavku imaju tu mogućnost.
Spicynodes Instapaper, ReaditLater, Readability, Klip.me, Evernote Clearly, etc. I’ve been experimenting with all of these for a little while (ok, Clearly the most recently since it’s new). For those who aren’t already familiar with these tools/services, they provide distraction-free reading when you’re browsing online. I’m not surprised that they’ve become so popular since webpages look increasingly like Times Square; these tools make reading so much more comfortable. If you don’t already use one, I highly recommend you choose one—maybe after reading this post. As they get more popular, there’s more competition. Since I’ve grown unhappy with my current service (ReaditLater), I decided to try out the others and see if it was worth a switch.
Izrada titlova za video – sagud.xyz Koliko ste puta naletjeli na neki video koji bi bilo baš dobro pustiti krizmanicima ili mladima, no video je na engleskom, koji ipak ne poznaju svi toliko dobro? Puno ljudi krene u mukotrpan posao prevođenja, pri čemu je najmučnije precizno pozicionirati titlove da počnu i završe u pravom trenutku. Nakon puno pokušavanja i istraživanja otkrio sam kako je moguće bez puno muke u jednome satu prevesti 10 minuta videozapisa, što je jako brzo. Kad sam čuo kako neki ljudi rade titlove, pao mi je mrak na oči. Dakle, ovo su primjeri koje ne treba slijediti jer su prespori i prenaporni:X otvoriti neki program za uređivanje videa i ubacivati tekst na video u određenom vremenuX otvoriti Word i prvo napisati cijeli tekst videa, a poslije ga kroz neki program ubaciti u videoX otvoriti .srt datoteku u Notepadu i ručno upisivati od kada do kada traje određeni titl (I sâm sam tako nekoć radio!)
Mind42 Instapaper: Save interesting web pages for reading later Of all forms of literature, however, the essay is the one which least calls for the use of long words. The principle which controls it is simply that it should give pleasure; the desire which impels us when we take it from the shelf is simply to receive pleasure. Everything in an essay must be subdued to that end. Timeline