background preloader

Gantt chart

Gantt chart
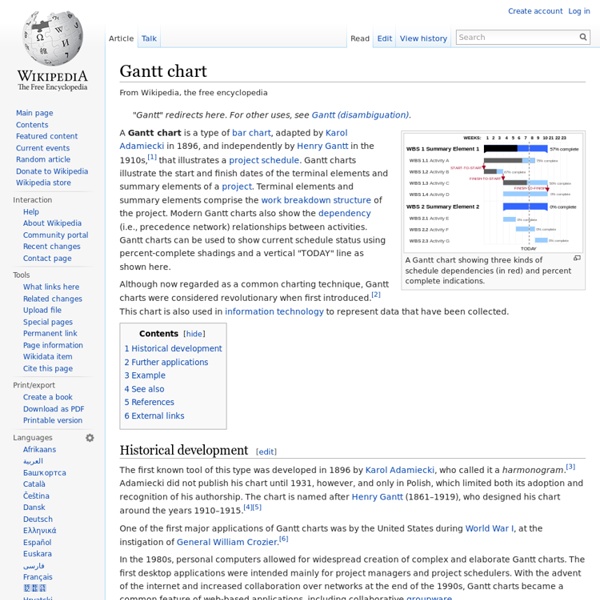
A Gantt chart showing three kinds of schedule dependencies (in red) and percent complete indications. Although now regarded as a common charting technique, Gantt charts were considered revolutionary when first introduced.[2] This chart is also used in information technology to represent data that have been collected. Historical development[edit] The first known tool of this type was developed in 1896 by Karol Adamiecki, who called it a harmonogram.[3] Adamiecki did not publish his chart until 1931, however, and only in Polish, which limited both its adoption and recognition of his authorship. In the 1980s, personal computers allowed for widespread creation of complex and elaborate Gantt charts. Further applications[edit] There are many computer applications supporting the use of Gantt charts for employee scheduling. Example[edit] In the following example there are seven tasks, labeled A through G. Once this step is complete, one can draw a Gantt chart or a network diagram. See also[edit]

Gantt Get the most out of your valuable resources, i.e., Your Team,to accomplish critical tasks that are overdue by effectively realigning members based on their skills. You can also quickly gain insights into how your resources are being utilized in a matter of few minutes. Work breakdown structure Example of a product-oriented work breakdown structure of an aircraft system. A work breakdown structure (WBS), in project management and systems engineering, is a deliverable-oriented decomposition of a project into smaller components. Overview[edit] WBS is a hierarchical and incremental decomposition of the project into phases, deliverables and work packages. It is a tree structure, which shows a subdivision of effort required to achieve an objective; for example a program, project, and contract.[2] In a project or contract, the WBS is developed by starting with the end objective and successively subdividing it into manageable components in terms of size, duration, and responsibility (e.g., systems, subsystems, components, tasks, subtasks, and work packages) which include all steps necessary to achieve the objective. Example of work breakdown structure applied in a NASA reporting structure.[2] History[edit] The document has been revised several times, most recently in 2011. 100% rule[edit]

Gantt project management software with Gantt chart Wrike's Gantt chart maker helps you create interactive Gantt charts to visualize your plans in real time and lets you update the schedule with a couple of mouse clicks. "The Gantt chart feature is outrageously useful. I've worked through a lot of projects, you know, in my head… I actually started printing and cutting out the tasks on paper and laying them out in the order they belonged… and finally said, "There's got to be a program for this." Thank you for being that program." Edward Pluchar, Facilities Manager at Giant Steps Wrike helps you get a complete picture of the project progress Keep all project data in one hub With Wrike, your team has 24/7 access to the up-to-date project schedules, tasks, discussions and files. Thanks to the integration with Dropbox, Box and Google Drive, all project documentation is always at hand when your team needs it. Share and collaborate in real time Get updates in real time Adjust your plans easily

Work Breakdown Structure (WBS) Template Introduction The Work Breakdown Structure (WBS) is a view into the project which shows what work the project encompasses. It is a tool which helps to easily communicate the work and processes involved to execute the project. The Project Manager and project team use the WBS to develop the project schedule, resource requirements and costs. There are many ways you can present the WBS for your project; this template provides many of the most popular layouts from which you can choose. In order to save space in this work breakdown structure template we only developed the WBS examples down to the third level. The Work Breakdown Structure presented here represents all the work required to complete this project. Outline View The outline view presents an easy to view and understand layout for the WBS. 1. Hierarchical Structure The hierarchal structure is similar to the outline view but without indentation. Tabular View The Tabular View is a nicely organized table view of the WBS. Tree Structure View

Gantt Using interactive Gantt chart capabilities in Smartsheet is a great way to visualize your project. You can customize your chart with conditional formatting to highlight team members' tasks or indicate status levels with different colors. Your team or clients will instantly "get it" and understand the tasks and related dependencies. Plus, it couldn't be easier to update with drag-and-drop editing (even if you've never used one before!). Get Started Now

Online Gantt Chart - Web Based Gantt Chart || TeamGantt

Related: