
What is Pattern Analysis? PATN is a software package that performs Pattern Analysis. PATN aims to try and display patterns in complex data. Complex in PATN's terms, means that you have at least 6 objects that you want to know something about and a suite of more than 4 variables that describe those objects. Data must be in the form of a spreadsheet of rows (the objects in PATN) and the columns (variables), as in Microsoft Excel™. There are usually around 7 components to a 'realistic' (read as adequate, comprehensive, fair, reasonable or intelligent) pattern analysis in PATN- Import the data Check the data using PATN's Visible Statistics functions. PATN is setup to make it easy for you to follow this process.
Introduction to Complex Systems by David Kirshbaum I. Introduction: Complex Systems Theory : Basic Definition II. III. I. A Complex System is any system which involves a number of elements, arranged in structure(s) which can exist on many scales. Previously, when studying a subject, researchers tended to use a reductionist approach which attempted to summarize the dynamics, processes, and change that occurred in terms of lowest common denominators and the simplest, yet most widely provable and applicable elegant explanations. But since the advent of powerful computers which can handle huge amounts of data, researchers can now study the complexity of factors involved in a subject and see what insights that complexity yields without simplification or reduction. Scientists are finding that complexity itself is often characterized by a number of important characteristics: (II.1) Self-Organization(II.2) Non-Linearity(II.3) Order/Chaos Dynamic(II.4) Emergent Properties. (II.1) Self-Organization Examples (II.2) Non-Linearity
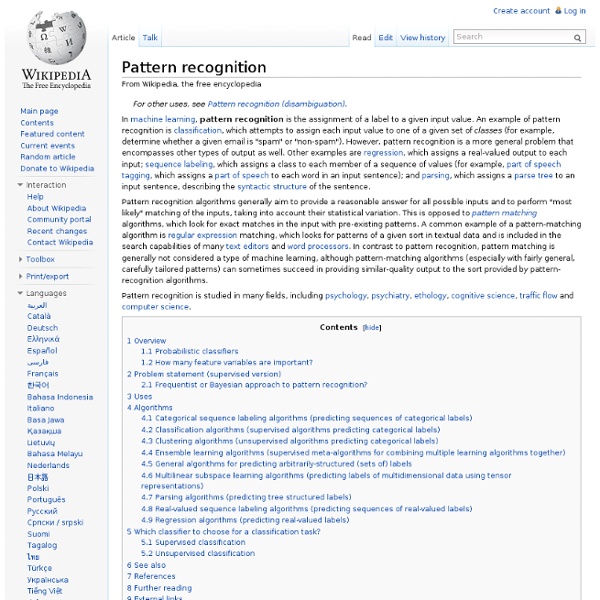
Data fusion Data fusion is the process of integration of multiple data and knowledge representing the same real-world object into a consistent, accurate, and useful representation. fusion of the data from 2 sources (dimension #1 & #2) can yield a classifier superior to any classifiers based on dimension #1 or dimension #2 alone Data fusion processes are often categorized as low, intermediate or high, depending on the processing stage at which fusion takes place.[1] Low level data fusion combines several sources of raw data to produce new raw data. The expectation is that fused data is more informative and synthetic than the original inputs. For example, sensor fusion is also known as (multi-sensor) data fusion and is a subset of information fusion. Geospatial applications[edit] In the geospatial (GIS) domain, data fusion is often synonymous with data integration. A simplified example of this process is shown below where data set "α" is fused with data set β to form the fused data set δ. See also[edit]
NodeXL Graph Gallery: Graph Details The graph represents a network of 1,613 Twitter users whose recent tweets contained "#agchat", or who were replied to or mentioned in those tweets, taken from a data set limited to a maximum of 18,000 tweets. The network was obtained from Twitter on Tuesday, 13 December 2016 at 16:56 UTC. The tweets in the network were tweeted over the 9-day, 18-hour, 37-minute period from Saturday, 03 December 2016 at 22:04 UTC to Tuesday, 13 December 2016 at 16:42 UTC. The graph is directed. The graph's vertices were grouped by cluster using the Clauset-Newman-Moore cluster algorithm. The graph was laid out using the Harel-Koren Fast Multiscale layout algorithm. Top Word Pairs in Tweet in Entire Graph:[355] agblog,via[199] agchat,conference[151] rt,agchat[121] vancecrowe,agchat[102] kansas,city[99] rt,agchatfound[86] rt,farmfutures[71] agchat,agchat[67] farm,futures[67] via,beef
untitled Thanks for your interest in Copycat! Copycat is written in Common Lisp. The system is unfortunately rather outdated: it will not run as is without some updates for modern versions of Common Lisp, and some platform-specific modifications to the graphics files. I am hoping that it will be rewritten in a more platform independent way sometime soon. I am still making the source files available. To get the source files, go to : and at your home machine, untar the file to get the source files. If your system can't deal with tar files, then go to and individually get each source file. To get Jim Marshall's Metacat project, go to: Scott Bolland of the University of Queensland wrote a Java version of Copycat and a tutorial; the web site is
Data feed Data feed formats[edit] Emerging semantic data feed[edit] The Web is evolving into a web of data or Semantic Web. Data will be encoded by Semantic Web languages like RDF or OWL according to many experts' visions. So, it is not difficult to envision data feeds will be also in the form of RDF or OWL. CSV datafeed and affiliate marketing[edit] CSV datafeeds are mostly being used within the affiliate marketing. See also[edit] Semantic publishing References[edit] External links[edit]
New DataBasic Tool Lets You “Connect the Dots” in Data Catherine D'Ignazio and I have launched a new DataBasic tool and activity, Connect the Dots, aimed at helping students and educators see how their data is connected with a visual network diagram. By showing the relationships between things, networks are useful for finding answers that aren’t readily apparent through spreadsheet data alone. To that end, we’ve built Connect the Dots to help teach how analyzing the connections between the “dots” in data is a fundamentally different approach to understanding it. The new tool gives users a network diagram to reveal links as well as a high level report about what the network looks like. Using network analysis helped Google revolutionize search technology and was used by journalists who investigated the connections between people and banks during the Panama Papers Leak. Learn more about Connect the Dots and all the DataBasic tools here. Have you used DataBasic tools in your classroom, organization, or personal projects?
Signals intelligence The last German message intercepted by the British during World War II, signaling Germany's unconditional surrender As a means of collecting intelligence, signals intelligence is a subset of intelligence collection management, which, in turn, is a subset of intelligence cycle management. History[edit] Intercepting written but encrypted communications, and extracting information, probably did not lag long after the development of writing. More technical definitions of SIGINT and its branches[edit] In the United States and other nations involved with NATO, signals intelligence is defined as:[2] A category of intelligence comprising either individually or in combination all communications intelligence (COMINT), electronic intelligence (ELINT), and foreign instrumentation signals intelligence, however transmitted. Intelligence derived from communications, electronic, and foreign instrumentation signals. The JCS definition may overemphasize "foreign instrumentation signals". Targeting[edit] "1.
Spreadsheets Are Graphs Too! - Neo4j Graph Database By Felienne Hermans, Assistant Professor, Delft University of Technology | August 26, 2015 Editor’s Note: Last May at GraphConnect Europe, Felienne Hermans – Assistant Professor at Delft University of Technology – gave this engaging talk on why you shouldn’t overlook the power of the humble spreadsheet. Listen to or read her presentation below. Register for GraphConnect San Francisco to hear more speakers like Felienne present on the emerging world of graph database technologies. People often ask me, ‘How is it possible that you research spreadsheets? Did you actually write a dissertation on spreadsheets?’ The answer is, Yes, I did. Ninety-five percent of all U.S. companies still use spreadsheets for financial reporting, so spreadsheets run the financial domain. Analysts decide the strategy of their company based on spreadsheets. Either way, analysts make decisions that steer the company based on the data in their spreadsheets. Spreadsheets often exist under the radar. Spreadsheets Are Code
Federated search Federated search is an information retrieval technology that allows the simultaneous search of multiple searchable resources. A user makes a single query request which is distributed to the search engines participating in the federation. The federated search then aggregates the results that are received from the search engines for presentation to the user. Purpose[edit] Federated search came about to meet the need of searching multiple disparate content sources with one query. Process[edit] As described by Peter Jacso (2004[1]), federated searching consists of (1) transforming a query and broadcasting it to a group of disparate databases or other web resources, with the appropriate syntax, (2) merging the results collected from the databases, (3) presenting them in a succinct and unified format with minimal duplication, and (4) providing a means, performed either automatically or by the portal user, to sort the merged result set. Implementation[edit] Federating across three search engines
Tutorial 1: Introducing Graph Data Next: Introducing RDF The semantic web can seem unfamiliar and daunting territory at first. If you're eager to understand what the semantic web is and how it works, you must first understand how it stores data. After this tutorial, you should be able to: Describe in basic terms what the semantic web is.Experience the paradigm-shift of storing information as a graph database, rather than a hierarchical or relational database.Understand that the semantic web of data is defined using Resource Description Framework (RDF).Understand the basic principles of RDF statements and how they can define data graphs. Estimated time: 5 minutes If you come from a traditional IT background and are used to the idea of storing data either in a hierarchy (for example XML) or in a relational database (for example MySQL, MS SQL), you may not yet have come across Resource Description Framework, or RDF. Although it might not be familiar to you, it is the type of database that builds the semantic web, globally. 03.