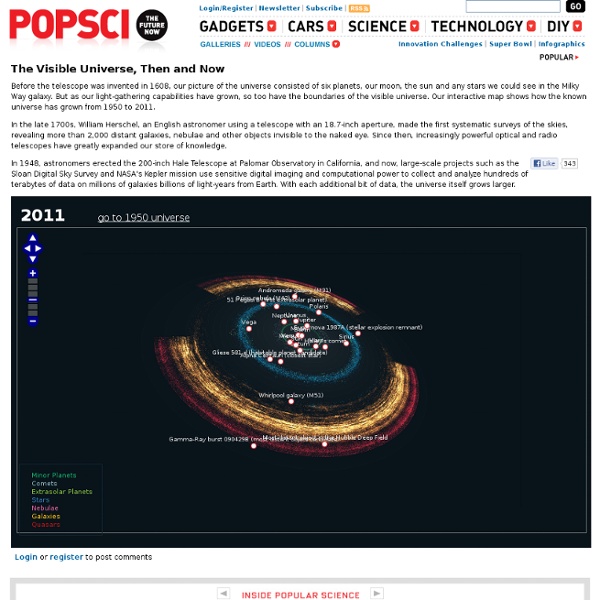
The Visible Universe, Then and Now
Before the telescope was invented in 1608, our picture of the universe consisted of six planets, our moon, the sun and any stars we could see in the Milky Way galaxy. But as our light-gathering capabilities have grown, so too have the boundaries of the visible universe. Our interactive map shows how the known universe has grown from 1950 to 2011. In the late 1700s, William Herschel, an English astronomer using a telescope with an 18.7-inch aperture, made the first systematic surveys of the skies, revealing more than 2,000 distant galaxies, nebulae and other objects invisible to the naked eye. Since then, increasingly powerful optical and radio telescopes have greatly expanded our store of knowledge.
Related: Example Models
International Open Government Data Camp looks to build community
There’s a growing international movement afoot worldwide to open up government data and make something useful with it. Civic apps based upon open data are emerging that genuinely serve citizens in a beneficial ways that officials may have not been able to deliver, particularly without significant time or increased expense. For every civic app, however, there’s a backstory that often involves a broad number of stakeholders. Governments have to commit to open up themselves but will in many cases need external expertise or even funding to do so. Citizens, industry and developers have to use the data, demonstrating that there’s not only demand but skill outside of government to put open data to work in the service of accountability, citizen utility and economic opportunity. Galvanizing the co-creation of civic services, policies or apps isn’t easy but the potential of the civic surplus attracted the attention of governments around the world. What will this camp change?
Analysing the water crisis in Australia's Marray-Darling Basin
Here is how one might go about developing a model like this: 1. Create a model, a hypothesis - describing the problem, and consequences of attempted solutions to date 2. Elaborate the model with subject matter experts - from all walks, agriculture, industry, government, science, ... - Bring in other people's perspectives on the model 3. 4. 5. 6. 7. 8. 9. 10.
Simple Business Improvement Model
This Southbeach Notation diagram illustrates some of the Southbeach Semantics in a simple model of a business. Its purpose is both to describe the situation and provide a basis from which to agree on key facts (e.g. there are insufficient sales) and priorities (e.g. marketing is the focus of attention). Southbeach models exist to support the analysis process in improving the situation. Thus, each element of a Southbeach model can provide a pivot point for improvement. Some examples are provided below. Here is how to read this diagram: Spending produces (arrow) materials which are used (small box end) by the manufacturing process to create (star) products which produce sales which produce revenue which produce profit. Note the short dashed lines across some of the effects. Here are some improvement alternatives illustrated by this diagram: All green boxes are useful, so increasing them is likely to increase the usefulness of the overall system. Blue boxes are improvement actions.
Drucker - Spirit of an Organisation
This Southbeach model shows a perspective of Peter F. Drucker; "the man who invented management". The column on the left represents qualities of the people in an organisation, and on the right, we have the activities of the organisation itself. These two systems are inextricably interlocked and require each other in order to succeed. In Drucker's book, The Practice of Management, at the beginning of Chapter 13: The Spirit of an Organisation, he says: "Two sayings sum up the 'spirit of an organisation'. Here lies a manwho knew how to enlist in his servicebetter men than himself The other is the slogan of the drive to find jobs for the physically handicapped: It's the abilities,not the disabilities,that count. Management by objectives tells a manager what they ought to do. Sustainable success for an organisation is a result of individual success at every level, and individual success is enabled and amplified by the organisation that focuses on its people and on building on their successes.
Risk Management
This Southbeach model shows some general principles of risk management. In this example, Work is the focus and is done in order to achieve the Goal. Issues and Risks may counteract achievement of the goal. The following Southbeach model provides a more detailed example of risk management in action with the addition of a grid to separate the agents in the model by timespan and aspect. This example shows swim lanes running across the page separating different aspects of a project into meetings, activities, Issues & risks, and mitigations. The focus of this model is "delivery of phase 1 of the solution".
Related:


