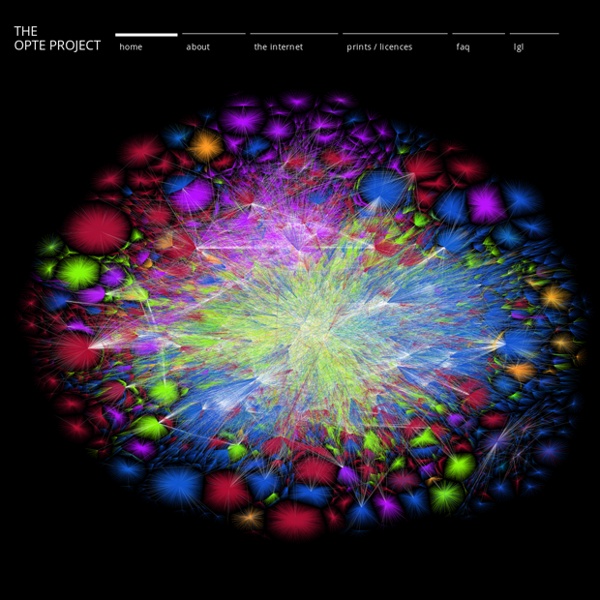
16 Awesome Data Visualization Tools From navigating the Web in entirely new ways to seeing where in the world twitters are coming from, data visualization tools are changing the way we view content. We found the following 16 apps both visually stunning and delightfully useful. Visualize Your Network with Fidg’tFidg’t is a desktop application that aims to let you visualize your network and its predisposition for different types of things like music and photos. See Where Flickr Photos are Coming FromFlickrvision combines Google Maps and Flickr to provide a real-time view of where in the world Flickr photos are being uploaded from. See Where Twitters are Coming FromFrom the maker of Flickrvision (David Troy) comes Twittervision, which, you guessed it, shows where in the world the most recent Twitters are coming from. New Ways to Visualize Real-Time Activity on DiggDigg Labs offers three different ways to visualize activity in real-time on the site, building on the original Digg Spy feature.
Cartographie conceptuelle et didactique de l' information Sur le site de l' Académie de Nantes, voici une ressource intéressante proposée par Pascal Duplessis et fruit d'un travail collectif . Il s'agit là d'une étude complète et très bien documentée, accompagnée de diverses cartes conceptuelles de grande qualité. Le thème central est l' apport des cartes conceptuelles à l' enseignement de l' information documentation. "Il s' agira en particulier de montrer comment les cartes de concepts peuvent faciliter et accompagner le travail du professeur documentaliste". Ce travail s' adresse en premier lieu aux documentalistes mais l' analyse en profondeur de la méthode et la qualité des cartes en font un document de choix pour tous ceux et celles qui s' intéressent à la cartographie conceptuelle. Une dizaine de cartes sont téléchargeables ici au format PDF. Conceptogramme : les outils de recherche Le document Référence documentographique
The Best Tools for Visualization Visualization is a technique to graphically represent sets of data. When data is large or abstract, visualization can help make the data easier to read or understand. There are visualization tools for search, music, networks, online communities, and almost anything else you can think of. Visualize Social Networks Last.Forward: Thanks to Last.fm's new widget gallery, you can now explore a wide selection of extras to extend your Last.fm experience. Last Forward Friends Sociomap: Friends Sociomap is another Last.fm tools that generates a map of the music compatibility between you and your Last.fm friends. Fidg't: Fidg't is a desktop application that gives you a way to view your networks tagging habits. Fidg't The Digg Tools: Digg.com has some of the best web-based visualization tools on the net, so they're a must for any visualization list. One more: Digg Radar. YouTube: You can discover related videos using YouTube's visualizations. Visualize Music Musicovery Last.fm music visual tools: Amazon Data
SourceForge.net: Fidgt Visualizer - Project Web Hosting - Open Source Software InfoVis CyberInfrastructure- Pathfinder Network Scaling Software > Radial Trees Description | Pros and Cons | Applications | Details | Usage Hints | References | Acknowledgments (Click image for better view) Radial tree layout uses focus + context (fisheye) technique for visualizing and manipulating large hierarchies. Many hierarchies, such as controlled vocabularies or file directory structures, are too large to display in their entirety on a computer screen. The Radial Tree package is available as part of the XML toolkit. DemoFile.java takes directory name as argument and visualizes its directory structure in Radial Tree layout. A radial tree layout places the selected/focus node in the center of the display. Start the XML toolkit, load a tree data set, and select 'Radial Tree' to display it. G. This Radial Tree package was developed as a final project of Information Visualization class, Spring 2003, SLIS, IUB by Nihar Sheth (nisheth@indiana.edu) and Qin Cai.
Ars Technica Guide to Virtualization: Part II In the previous installment of the Virtualization Guide, I talked in general ways about the exculsive hardware access privileges that the OS reserves for itself. Now it's time to nuance that picture a bit, so you can see exactly how the OS retains the upper hand over applications and users. This brief installment sets the stage for Part III, which will talk in some detail about Intel VT. A microprocessor does more than just blindly run whatever instructions are loaded into its front end, without regard for where those instructions came from. In order to keep applications from usurping any part of the OS's privileged access to system hardware, processors provide a mechanism that allows different programs to run at different privilege levels. The hardware/OS/application stack, with rings On any given processor, Ring 0 is the most privileged level, and any software that runs in Ring 0 is running in the most privileged state that the hardware supports.
prefuse | interactive information visualization toolkit Christophe Tricot - Cartographie Sémantique : des connaissances à la carte. News Création d'un portail sur la cartographie sémantique : www.knowledge-mapping.net "Cartographie Sémantique : des connaissances à la carte." Le 24 novembre 2006, j’ai présenté ma thèse intitulée : « Cartographie sémantique : des connaissances à la carte ». Voici quelques ressources associées : La présentation au format powerpoint et pdf : Le mémoire au format pdf : Le jury était composé de : Jean-Paul Barthès : Professeur des Universités, Président du jury Guy Melançon : Professeur des Universités, Rapporteur Xavier Briffault : Chargé de recherche CNRS HDR, Rapporteur Anne Dourgnon‑Hanoune : Ingénieur recherche EDF R&D, Membre invité André Manificat : Directeur du GRETh INES-RDI, Membre invité Christophe Roche : Professeur des Universités, Directeur de thèse Daniel Beauchêne: Maître de Conférences, Codirecteur de thèse Encore merci à tous ceux qui étaient présents ce jour important.
Ars Technica Guide to Virtualization: Part I In 2003, Intel announced that it was working on a technology called "Vanderpool" that was aimed at providing hardware-level support for something called "virtualization." With that announcement, the decades-old concept of virtualization had officially arrived on the technology press radar. In spite of its long history in computing, however, as a new buzzword, "virtualization" at first smelled ominously similar to terms like "trusted computing" and "convergence." Fast-forward to 2008, and virtualization has gone from a solution in search of a problem, to an explosive market with an array of real implementations on offer, to a word that's often mentioned in the same sentence with terms like "shakeout" and "consolidation." Virtualization implementations are so widespread that some are even popular in the consumer market, and some (the really popular ones) even involve gaming. Abstraction, and the big shifts in computing The hardware/software stack Figure 1: Hardware/OS stack