

40 maps that explain the world By Max Fisher By Max Fisher August 12, 2013 Maps can be a remarkably powerful tool for understanding the world and how it works, but they show only what you ask them to. So when we saw a post sweeping the Web titled "40 maps they didn't teach you in school," one of which happens to be a WorldViews original, I thought we might be able to contribute our own collection. Pulse of the Nation: U.S. Mood Throughout the Day inferred from Twitter Click for high-resolution PDF version (11MB) Video A time-lapse video of the maps, cycled twice, is available below (best viewed at 720p): Mood Variations A number of interesting trends can be observed in the data. First, overall daily variations can be seen (first graph), with the early morning and late evening having the highest level of happy tweets.
Twitter Search, Monitoring, & Analytics With iOS 9, Search lets you look for content from the web, your contacts, apps, nearby places, and more. Powered by Siri, Search offers suggestions and updates results as you type. There are two ways to use Search on your iOS device. Quick Search
10 Free Twitter Tools for Analysis, Trends, And Insights With over 36,000 tweets being made per minute, there are loads of conversations about you and your brand taking place on Twitter. To keep up with this data, we are now witnessing the emergence of numerous tools, applications and services which enable you to analyze your twitter account and keep an eye on the competition. Here we look at 10 tools which can be utilized by advanced users for conducting focused research about brands and the tweets related to them. 40 more maps that explain the world Maps seemed to be everywhere in 2013, a trend I like to think we encouraged along with August's 40 maps that explain the world. Maps can be a remarkably powerful tool for understanding the world and how it works, but they show only what you ask them to. You might consider this, then, a collection of maps meant to inspire your inner map nerd. I've searched far and wide for maps that can reveal and surprise and inform in ways that the daily headlines might not, with a careful eye for sourcing and detail. I've included a link for more information on just about every one.
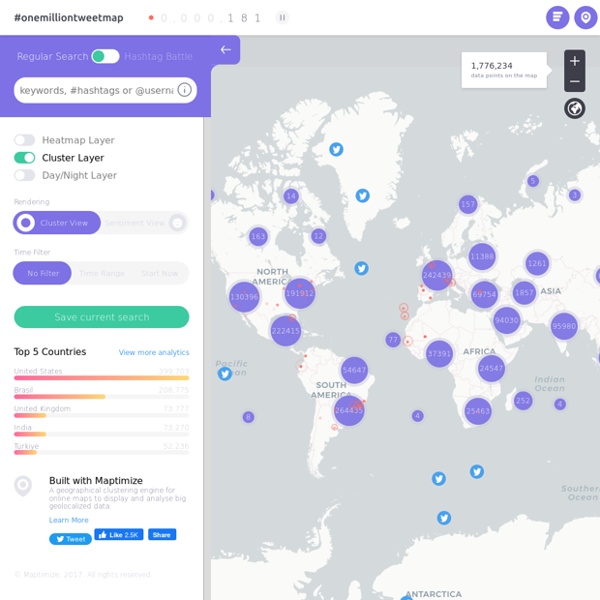
The geography of Tweets Give every Twitter user a brush and they will paint you the world — if they geotag their Tweets. Those of us on the Visual Insights team are obsessed with the patterns that emerge from aggregated Tweets over time. A continuing curiosity is about the geographical shapes that surface in geotagged Tweets. The images we’re sharing here use all of the geo-tagged Tweets since 2009 — billions of them.
How to Make a Map in Illustrator Every time I start thinking of a tutorial to write, I try to show techniques that I use in my job as a designer. For example, today I will be showing you how to make a nice little map. I was called to make a map for the university which was tedious but still fun. This can also be a neat little add-on to a party invitation or the like.First and most importantly turn on some music! Some Armin van Buuren thumping in the background helps the creative process. Secondly Make sure your computer is on.
Twitter StreamGraphs A StreamGraph is shown for the latest 1000 tweets which contain the search word. The default search query is 'data visualization' but a new one can be typed into the text box at the top of the application. You can also enter a Twitter ID preceded by the '@' symbol to see the latest tweets from that user. A parameter to the URL can be used to specify the initial search word. Department of History - Our Atlases About Our Atlases In 1938 the predecessors of today's Department of History at the United States Military Academy began developing a series of campaign atlases to aid in teaching cadets a course entitled, "History of the Military Art." Since then, the Department has produced over six atlases and more than one thousand maps, encompassing not only America’s wars but global conflicts as well. In keeping abreast with today's technology, the Department of History is providing these maps on the internet as part of the department's outreach program. The maps were created by the United States Military Academy’s Department of History and are the digital versions from the atlases printed by the United States Defense Printing Agency. We gratefully acknowledge the accomplishments of the department's former cartographers, Mr.