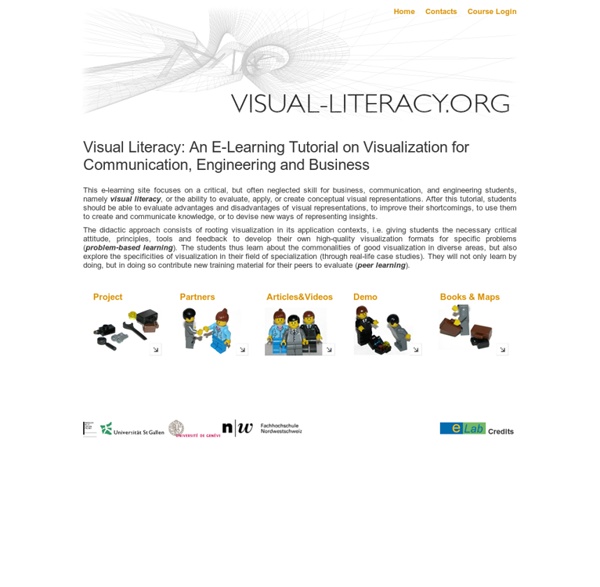


http://www.visual-literacy.org/index.html
Visual Thinking Spatial & Sequential Thinking Spatial and sequential thinking are two different mental organisations that affect the way people view the world. Sequential thinking is step by step linear thinking over time, while spatial thinking is an holistic system where all knowledge is interconnected in space. Auditory thinking is associated with sequential thinking and visual-spatial thinking is associated with spatial thinking.
Visual Thinking + Synthesis Photo by Ken Yeung I really enjoy talking complex subjects, processes or business problems and boiling them down to their core essence. This is becoming known as the process of "Visual Thinking". I use visual metaphors and storytelling to do this. My style of visual thinking is immediately recognizable and has helped me build a strong following of influential professionals who use my visuals in their own presentations and documents. A comprehensive archive of my visuals can be found on Flickr (please credit if you use them) and if you are interested in Visual Thinking as a discipline, you can visit VizThink for additional resources.
Five glorious presentations on visual thinking Do you think in words or pictures, or both? Visual thinking engages the part of the brain that handles visual processing, and is said to be both "emotional and creative" so you can "organise information in an intuitive and simultaneous way". A picture really might be worth a thousand words, while being easier to understand and recall. Tools - Cool Infographics Adioma creates information graphics out of your textual data, using timelines, grids and icons. Create impressive charts from spreadsheets. Assemble into dashboards, embed in websites, or simply share a link. A Python interactive visualization library that targets modern web browsers for presentation Cacoo is a free online drawing tool that allows you to create a variety of diagrams such as site map, flowchart, mind map, wire frame, UML diagram and network diagram. Crowdsourced Analytics Solution Marketplace - Make Sense of Big Data Free interactive charts created online in seconds ChartGo is an online graph maker tool. Simply choose your settings, enter your data and hit create.
Visual Literacy: An E-Learning Tutorial on Visualization for Communication, Engineering and Business RoCC Management Insights - Prof. Martin Eppler on Visualizing Knowledge for Management Research demonstrates the Value of Visualization for Knowledge Sharing (for Researchers) Improving Meetings through Interactive Visualization: Evidence managers can use (for Managers)
Graphical visualization of text similarities in essays in a book The problem A collection of essays is collated for readers with visualizing graphics. The graphics should both serve as a thematic and structural overview of each text, and pose the essay in question in relation to the other essays in the book. Welcome to the Virtual Crash Course in Design Thinking Welcome to the d.school’s Virtual Crash Course resource page! We know not everyone can make a trip to the d.school to experience how we teach design thinking. So, we created this online version of one of our most frequently sought after learning tools. Using the video, handouts, and facilitation tips below, we will take you step by step through the process of hosting or participating in a 90 minute design challenge. If you choose to participate, in 90 minutes you will be taken through a full design cycle by participating in The Gift-Giving Project. This is a fast-paced project where participants pair up to interview each other, identify real needs, and develop a solution to “redesign the gift-giving experience” for their partner.
Links to Infographic Sites, Visual Designers and C - Cool Infographics Randy's infographic design consultancy to Visualize Business Intelligence Jacob O'Neal's site focused on designing animated GIF infographics Company that helps visualize business data Rose Zgodzinski's site to help client find visual solutions Consulting, Design and Social + PR Brian Cragin is an infographic designer in San Diego A masterfully constructed infographic campaign can work wonders for your business Dashboard Design: Data Driven helps your clients better understand and act upon your information Dejure Design provides interactive and visual design services to social justice organizations seeking to make their legal work more accessible and engaging. One of the UK’s leading providers of infographics and data visualisation for bloggers and businesses of all sizes An interactive design industry We make important data beautiful and easy to understand We specialize in transmitting messages in a clear, simple and attractive way.
Visual thinking guides - Wikit This presents nine sources of visual thinking guides: Exploratree, Gamestorming, LexIcon, Education Oasis, TeacherVision, Freeology, Education Place and Writing Fun. Exploratree hosts a set of interactive thinking guides. This is a free web resource where you can use the guides, print them, edit them or make your own. MindMapping: Mind Maps, PDF Management and Reference Management Are you using mind mapping tools such as MindManager, FreeMind or XMind? And reference management tools such as JabRef, Endnote, or Zotero? And do you sometimes even create bookmark in PDFs? Then you should have a look at SciPlore MindMapping. SciPlore MindMapping is the first mind mapping tool focusing on researchers’ needs by integrating mind mapping with reference and pdf management.
Brain Wiring Continues Into Young Adulthood By Rick Nauert PhD Senior News Editor Reviewed by John M. Grohol, Psy.D. on September 23, 2011 New medical research tends to confirm that the human brain does not stop developing in adolescence, but continues well into our 20s, according to investigators at the University of Alberta.