

Physical Space Tweets: Pst! microCONTROL Pst! is the surreptitious beckoning of attention and the acronym for Physical Space Tweets. It is a small Ardunio storyteller installed in public space giving an audience a glimpse into a geo-tagged community’s topic feed. For the Leeds Pavillion at Mediamatic’s Amsterdam Biennale 2009 Pst! Pst! The piece locates a public social narrative by pulling an information feed from Twitter User profiles geographically aligned to Leeds with Twitter’s geocode API and then prints this information onto a mini LCD screen. See
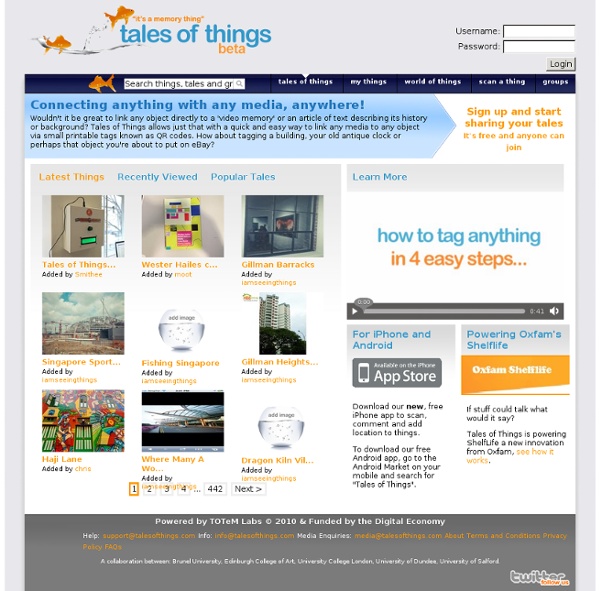
How to Add Anything to the Internet of Things: Cr Every object in existence can be tagged with any media, linked to tell a story, to recount its memories in a read/write environment and tweet when its interacted with. Its a concept that takes a bit of time to take in, for example a wall in Camden Town, London, tweeted me last week when someone replayed its memories of having a Banksy painted on it. That wall is part of the Internet of Things via the project TalesofThings. The best part is, its incredibly easy to add objects. Everything has a location so we are creating a ‘Geography of Everything’, a brave claim perhaps but one that develops a new a new kind of geography, the geography of things. Thats it, your object will now become part of the Internet of Things and will be able to tweet, have new stories/tales added as its passed on, sold or interacted with. Each thing created gets assigned a unique ‘qrcode’ which can be attached to your object.
Journaliste de données : data as storytelling Par Hubert Guillaud le 09/07/10 | 8 commentaires | 4,135 lectures | Impression En préfiguration de Lift France, l’un des ateliers était consacré au Journalisme de données, cette “nouvelle” façon de faire du journalisme, en utilisant les données comme matériel pour construire de l’information. Qu’est-ce que le data journalisme ? Quels sont les enjeux ? Décryptage, pour mieux comprendre la richesse du croisement entre données publiques et journalisme. Le journalisme de données, c’est l’exploitation de données sous des formats plus ou moins structurés, explique Lideth Rodriguez Solorzano, animatrice de l’atelier. Une narration visuelle Pour Caroline Goulard, qui vient de lancer le site ActuVisu (blog), un laboratoire étudiant de la visualisation de données, ce qui définit cette nouvelle profession ce sont les données. C’est un usage qui vient s’ajouter aux autres formes de journalisme, pour conceptualiser et visualiser l’information. Les chiffres sont aussi subjectifs que les mots
How to Read 1,000,000 Manga Pages: Visualizing Patterns in Games, Comics, Art, Cinema, Animation, TV, and Print Media | MIT World