Vitaly Friedman's Notebook: List of nifty tools for drawing diagrams, charts and flow-charts
List of nifty tools for drawing diagrams, charts and flow-charts » Aug 18, 11:53 AM Update: The site is experiencing heavy load at the moment, please be patient. Meanwhile, you can digg the article, if you think it could be useful for other users. Being a web-developer means not only being able to design web-sites or program their functionality.
Watch_Dogs WeAreData
In the video game Watch_Dogs, the city of Chicago is run by a Central Operating System (CTOS). This system uses data to manage the entire city and to solve complex problems,such as traffic,crime, power distribution and more... This is not fiction anymore. Smart cities are real, it’s happening now.
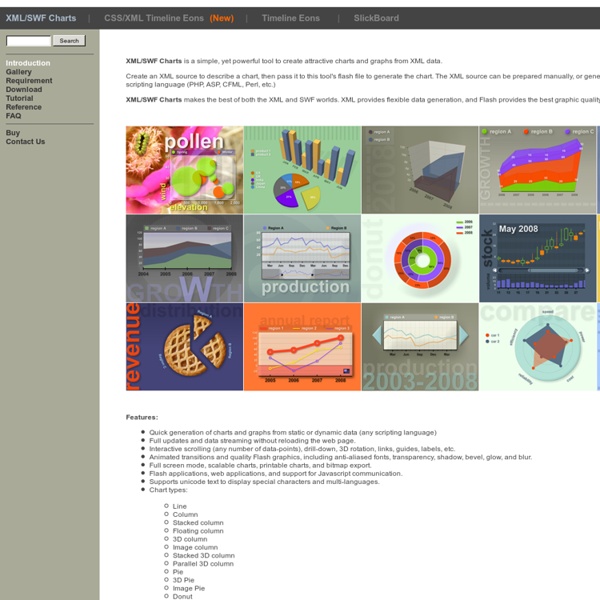
10 Useful Flash Components for Graphing Data
By Jacob Gube Flash is an excellent technology for dealing with data visualization. It being client-side, it can reduce the amount of work your server has to perform in order to generate graphs and charts.
Graph Theory Tutorials
Chris K. Caldwell (C) 1995 This is the home page for a series of short interactive tutorials introducing the basic concepts of graph theory. There is not a great deal of theory here, we will just teach you enough to wet your appetite for more! Most of the pages of this tutorial require that you pass a quiz before continuing to the next page.
22 Useful Online Chart & Graph Generators
Have you ever encounter situations where you need to create a simple yet good-looking chart, graphs or diagrams and all you have is your browser? Charts are good and effective way to show relationship between entities but sometimes creating one can be pretty challenging especially when your favorite word processing software is not around. In today’s post, we want to highlight some of the best web services that allow you to create various charts and graphs online on-the-fly.
RDF-Gravity
Sunil Goyal, Rupert Westenthaler {sgoyal, rwestenthaler}@salzburgresearch.at Salzburg Research, Austria RDF Gravity is a tool for visualising RDF/OWL Graphs/ ontologies. Its main features are:
How to Create an Excel Dashboard - The Excel Charts Blog The Excel Charts Blog
Excel dashboards and executive reports are powerful, fairly easy to design and a great way to improve your Excel and data visualization skills. Because of its flexibility, you can virtually design any dashboard in Excel exactly the way you, or the users, imagined. And, best of all, you may want to implement it yourself or consider it a prototype and ask IT to implement it. Once you know what will the Excel dashboard be used for and what kind of metrics users expect, there are three major areas that you must address when creating it: how to bring data into your spreadsheets;how to manage the data and link it to the dashboard objects, like charts and tables;how to design the dashboard report. Let’s take a look at each of them.
Psychedelic Spirit Paintings, Alex Grey Art Gallery
Karma Jello Cannabis, Psychedelics, Comedians, Astronomy, Philosophy, Photography, Art, MMA Karma Jello » Culture » Art » Psychedelic Spirit Paintings, Alex Grey Art Gallery Psychedelic Spirit Paintings, Alex Grey Art Gallery POSTED BY JAMES HSU | Art, Psychedelics Share on facebookShare on twitterShare on pinterest_shareShare on stumbleuponShare on google_plusone_shareShare on emailMore Sharing Services
Google Uses Artificial Brains to Teach Its Data Centers How to Behave
A central cooling plant in Google’s Douglas County, Georgia data center. Photo: Google/Connie Zhou At Google, artificial intelligence isn’t just a means of building cars that drive on their own, smartphone services that respond to the spoken word, and online search engines that instantly recognize digital images. It’s also a way of improving the efficiency of the massive data centers that underpin the company’s entire online empire.