

Gephi UCINET Software Customer Support For customer support (e.g., ordering info, billing etc) contact roberta@analytictech.com. For tech support join the users group or contact support@analytictech.com. We prefer you try the users group first since the answer to your question may benefit others. In addition, you should check out the support page, which includes useful things like tutorial exercises. Fixes, improvements, upgrades UCINET is constantly being upgraded to fix problems, provide new capabilities, or generally make things better. Download and/or Purchase The program can be downloaded and used for free for 90 days. Requirements and Specifications Windows operating system Vista or later.
S Routines for Social Network Analysis in the R Environment Most of which involve social network analysis, though a wee bit 'o other stuff is available as well.... Introduction and Caveats This page serves, as one might expect, to allow other researchers to access some of the data analysis tools I've developed in the S language. Caveats: This software is provided on an unsupported, as-is basis, under the terms of the GNU Public License . Getting and Using R The R statistical computing environment is distributed under the GNU Public License , and can be freely obtained either as source or as precompiled binaries for a wide range of platforms. The Statnet Project Most of the material contained here is now part of the Statnet Project , a collaborative effort to develop Free Software tools for network analysis.
yEd - Graph Editor yEd is a powerful desktop application that can be used to quickly and effectively generate high-quality diagrams. Create diagrams manually, or import your external data for analysis. Our automatic layout algorithms arrange even large data sets with just the press of a button. yEd is freely available and runs on all major platforms: Windows, Unix/Linux, and Mac OS X. Key Features Import your own data from an Excel® spreadsheet (.xls) or XML Create diagrams with easevia an intuitive user interface. Automatically arrangeyour diagram elements. Export bitmap and vector graphicsas PNG, JPG, SVG, PDF, SWF yEd in 90 seconds Supported Diagrams yEd supports a wide variety of diagram types. Support Resources The yEd online support resources include the yEd Graph Editor manual and the yEd forum where you can give us feedback.
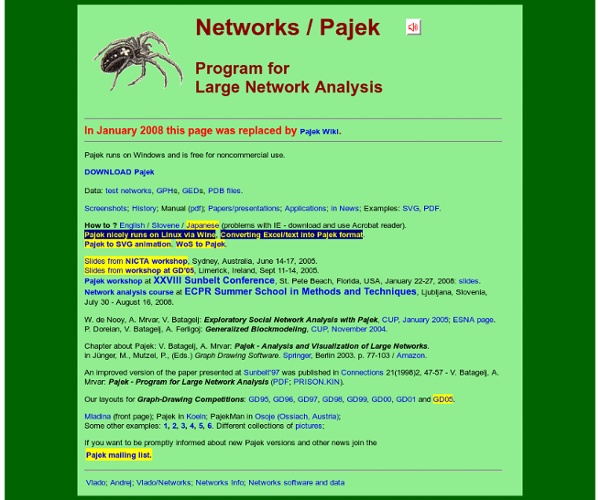
Introduction to Pajek Introduction If you have not yet downloaded Pajek, you can get it at this website. If you have not yet downloaded the Pajek file "prerequisites.paj" from our Blackboard site, click this link to get it now. It is the network of all courses offered at Bentley in Fall 2006, with the relation "is a prerequisite for." In this file, things written like this: Edit > Copy mean that you should click the Edit menu in Pajek, and then choose the Copy menu item. Opening a data file You can open Pajek first (from wherever you installed it on your machine) and then load the data file by File > Pajek Project File > Read. Alternatively, you can double-click the .PAJ file in Windows Explorer and when Windows asks you where the program that opens such files is, you point it to Pajek. When you have loaded the data into Pajek, you will see the text "Bentley Prerequisites Fall 2006 (168)" under the Networks section in the program. Seeing a graph Partitions Vectors Shrinking a network Final version
NodeXL: Network Overview, Discovery and Exploration for Excel - Home Gephi:Wiki | PortailSIG Python : transformer shapefile en un réseau topologique (graphe) Comment transformer un shapefile, format sans topologie, en un réseau topologique (topologie de réseau, voir la topologie dans « GRASS GIS : géométries, topologies et conséquences pratiques (vecteurs, rasters, volumes) ») de noeuds et d'arcs ou d'arêtes, c'est à dire un graphe mathématique ? C'est la question que s'est posée Ben Reilly sur son blog pragmaticgeographer.posterous.com/geometric-network-geoprocessing suite à la question suivante posée sur un Forum et au manque d'outils fournis par ESRI : " I currently have a geometric network that I've been working with using the Utility Network Analyst tools. Sa réponse a été : "The answer, sadly, is no. Il a donc développé des modules Python pour le faire, utilitynetwork puis nx_spatial, basés sur la théorie des graphes. Principes Nous ne nous occuperons pas ici d'exposer la théorie des graphes et ses applications dans le domaine des SIGs , ce n'est pas le but du sujet. Avec les fichiers shapefile shapefile de lignes noeuds du shapefile erreur
GUESS Manual The Graph Exploration System Version 1.0.1 (beta) Eytan Adar 1. GUESS features This tool is/includes: A completely refactored version of the Zoomgraph graph visualization system. This tool isn’t: A replacement to UCINET, Pajek, whatever else you may be using. 1. 2. 2.1 Installation. 4 2.2 Running. 4 3. 4. 4. 4.1 The GUESS .gdf format 9 4.2 GraphML. 14 5. 5.1 Queries and Sets. 16 5.2 The Information Window.. 18 6. 7. 7.1 Clustering. 23 7.2 Visualizing Fields. 23 7.3 Field, Graph, Node, Edge Statistics. 24 7.4 Random Graph Generation. 25 8. 9. 10. 11. 11.1 State Sensitive Queries. 31 11.2 State Alternative: Ranges. 31 12. 13. 14. 15. 15.1 Example 1: A Simple Button. 37 15.2 Example 2: A Threshold Slider 38 15.3 Example 3: A Network Monitor 40 15.4 Example 4: Remote control of GUESS. 43 15.5 Responding to clicks and other code bits. 44 16. 16.1 Signing GUESS. 48 16.2 Compiling Your Code. 48 16.3 Advanced Applet Features. 49 16.4 Building your own Application. 49 17. 18. 19. Appendix A. Appendix B. 2. 2.2 Running 3.
NetLogo Home Page NetLogo is a multi-agent programmable modeling environment. It is used by many tens of thousands of students, teachers and researchers worldwide. It also powers HubNet participatory simulations. It is authored by Uri Wilensky and developed at the CCL. What can you do with NetLogo? Join mailing lists here. Download NetLogo Go to NetLogo Web NetLogo comes with a large library of sample models. Statnet
Program for
Large Network Analysis by bihonglee Aug 25